Check Olares status and Olares Space usage
Use Olares Space when you need a remote view of your Olares status or want to check usage for cloud-assisted services such as backup storage and reverse-proxy traffic. For detailed, real-time CPU, memory, disk, network, pod, GPU, and app metrics, use Dashboard instead.
The information available depends on where you open it:
| Location | Use it for |
|---|---|
| Settings > your avatar > Olares Space | The recommended sign-in entry and a quick summary of the linked account, plan, backup storage, and traffic usage |
| Olares Space | Remote Olares status, active hosts, recent traffic, and billing-cycle usage |
| Dashboard in Olares | Detailed local resource and application diagnostics |
Connect Olares Space in Settings
Connect Olares Space from its dedicated page in Olares Settings. After the connection succeeds, you can view usage on this page, and Olares Space also appears under Settings > Integrations.
Use the Olares Space page to connect
Do not start from Settings > Integrations > Add account > Olares Space. Account binding is not supported from that entry yet.
- Open Settings in Olares.
- Click your avatar in the upper-left corner.
- Select the Olares Space card.
- When the QR code appears, scan it with the LarePass app on your mobile device.
- Wait for the page to show your Olares Space account and usage information.
Check the summary in Settings
- Open Settings in Olares.
- Click your avatar in the upper-left corner.
- Select the Olares Space card.
- Review the linked account, subscribed plan, backup storage, reverse-proxy service, and traffic usage shown on the page.
Use this view for a quick quota check. Open the Olares Space website when you need status details, a time range, or billing-cycle history.
Check resource usage in Olares Space
The Olares Space overview provides a remote summary of CPU, memory, and disk usage. Use it to check whether a system that you cannot access locally is online and nearing a resource limit.
On the Olares page, select the Overview tab.
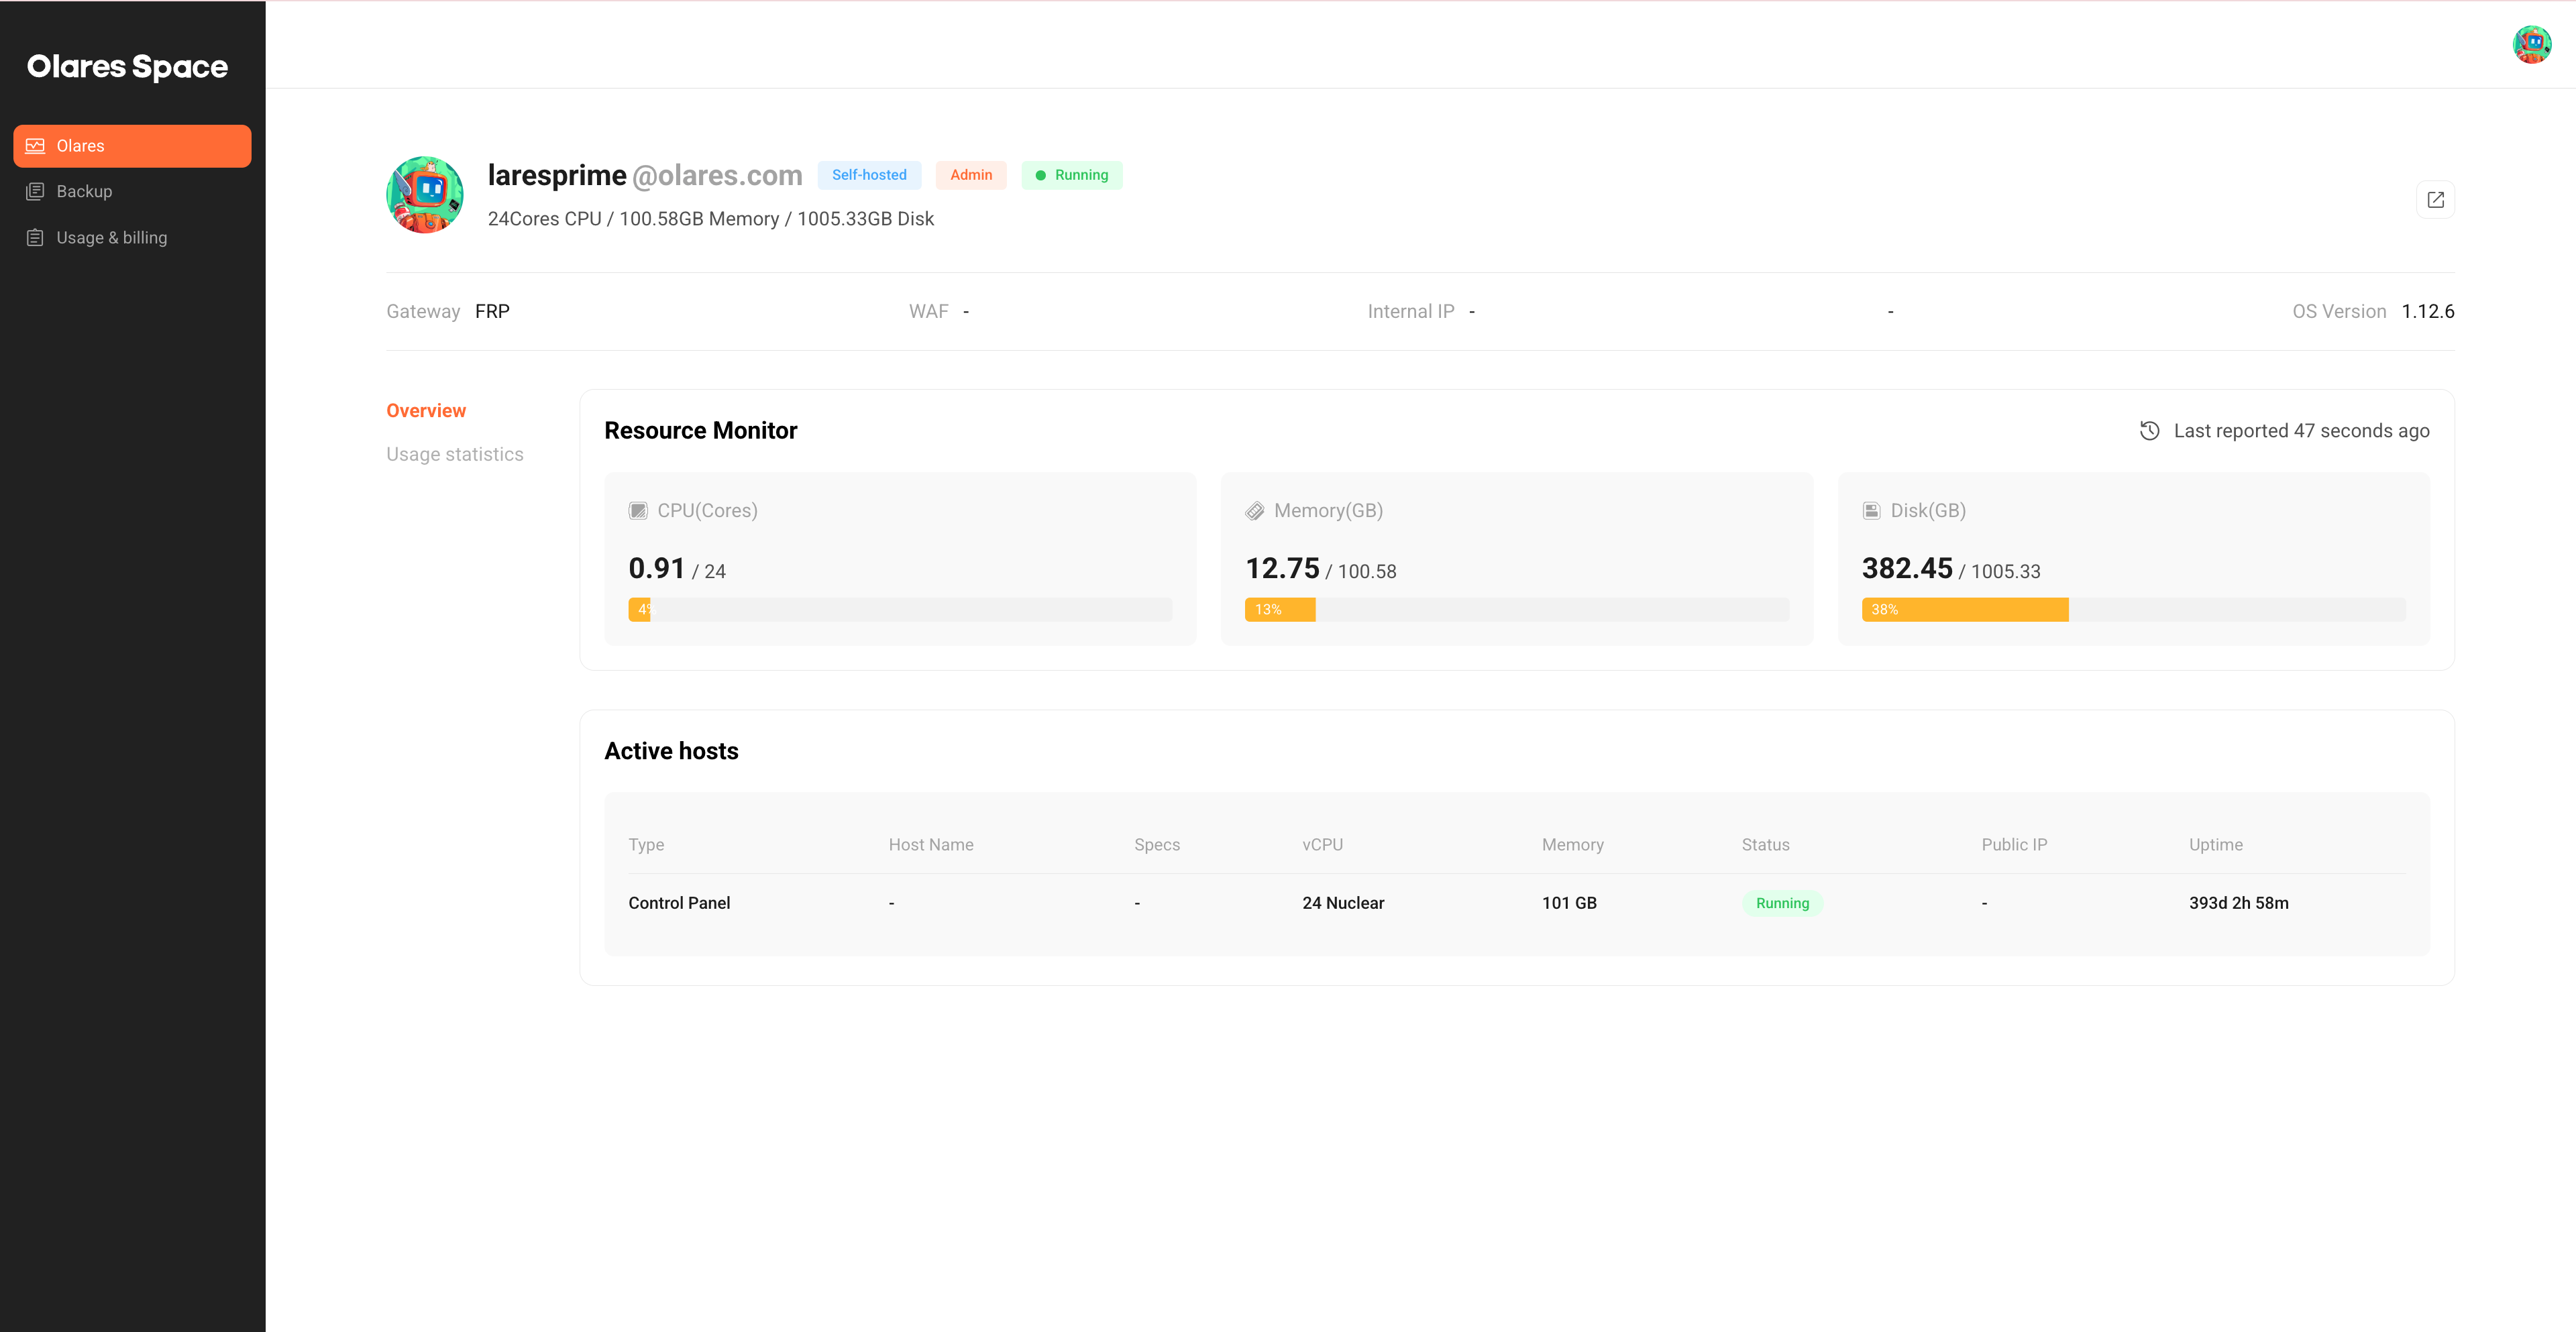
Locate the Resource Monitor section. It displays the real-time usage of CPU, memory, and disk.
Metric Description CPU (Cores) Current CPU usage in cores and the total available cores. Memory (GB) Current memory usage in GB and the total available memory. Disk (GB) Current disk usage in GB and the total available disk space.
Check active hosts
Check which hosts are currently running in your Olares cluster and their status.
- On the Olares page, select the Overview tab.
- Locate the Active hosts section. It displays the hosts currently running in the Olares cluster.
Check recent traffic usage
Check recent traffic usage to spot sudden increases and avoid exceeding your plan's limit.
INFO
For self-hosted Olares users, monitor traffic statistics for the reverse proxy service. If you exceed the monthly quota, speed is throttled to 5 Mbps. The free alternative is to use LarePass VPN or host your own FRP server.
On the Olares page, select the Usage statistics tab.
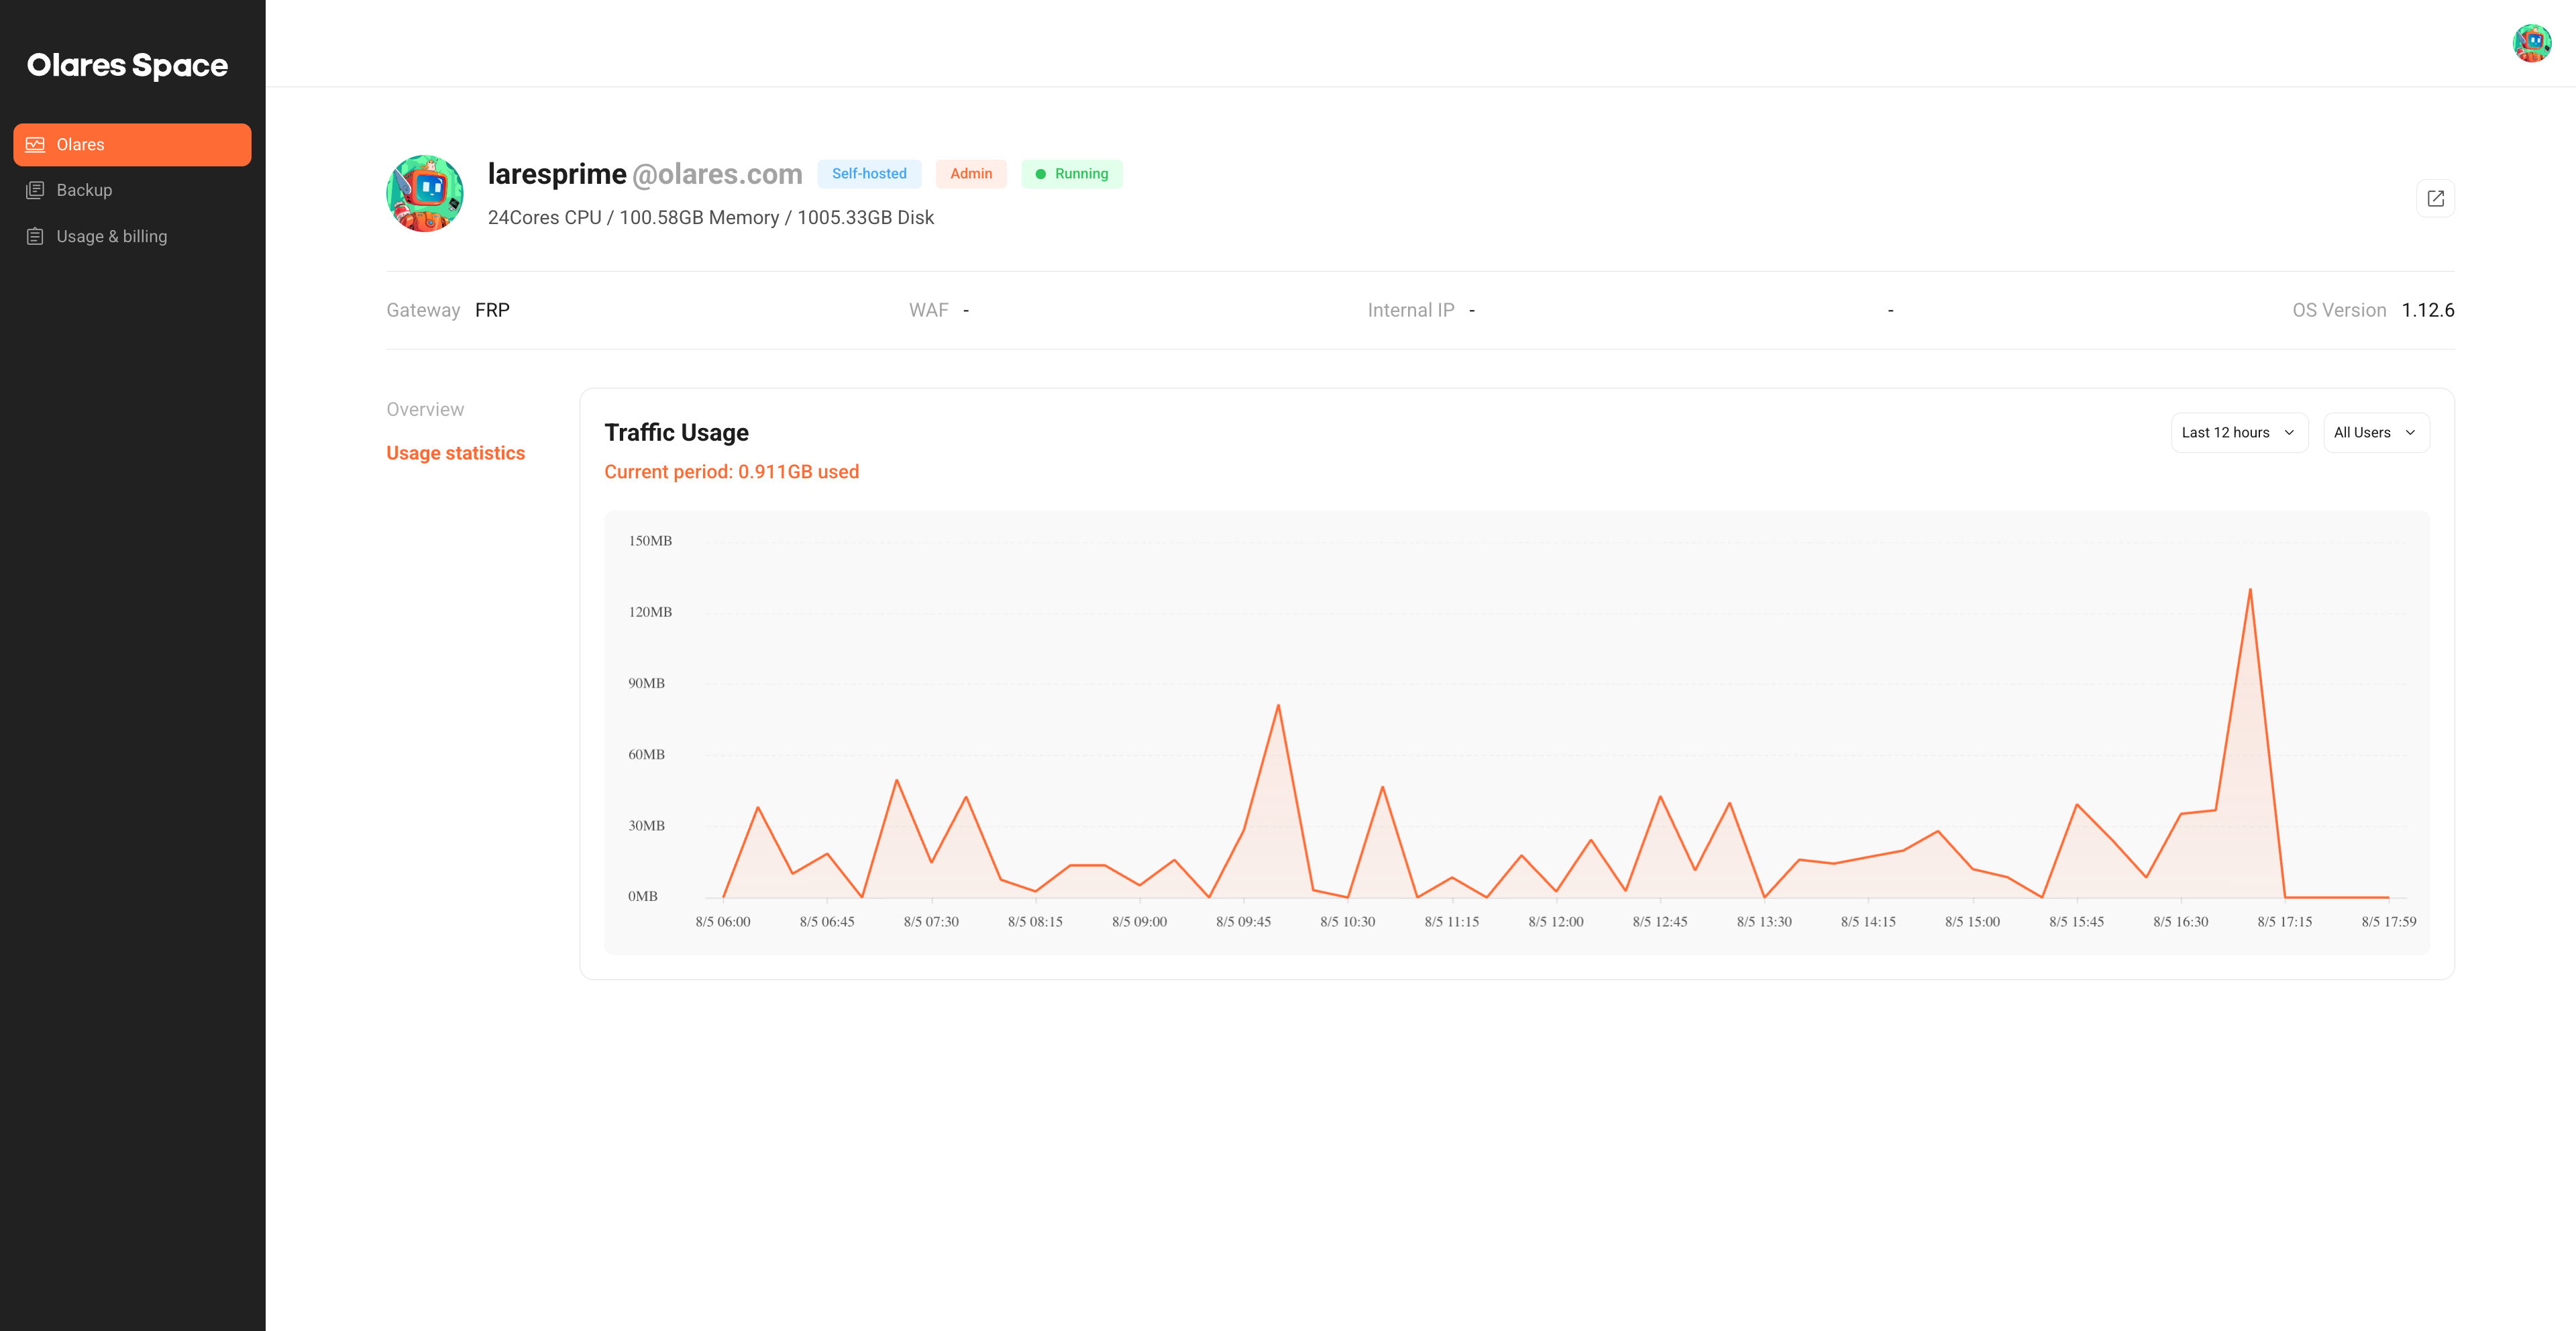
Locate the Traffic Usage section. By default, it shows traffic used by all users over the last 12 hours.
To change the time range, select one from the Last 12 hours drop-down list.
To view traffic for a specific user, select the account from the All Users drop-down list.
Check billing-cycle traffic usage
Review your monthly traffic usage to see how much data you have consumed in the current billing cycle.
From the left navigation pane, select Usage & billing.
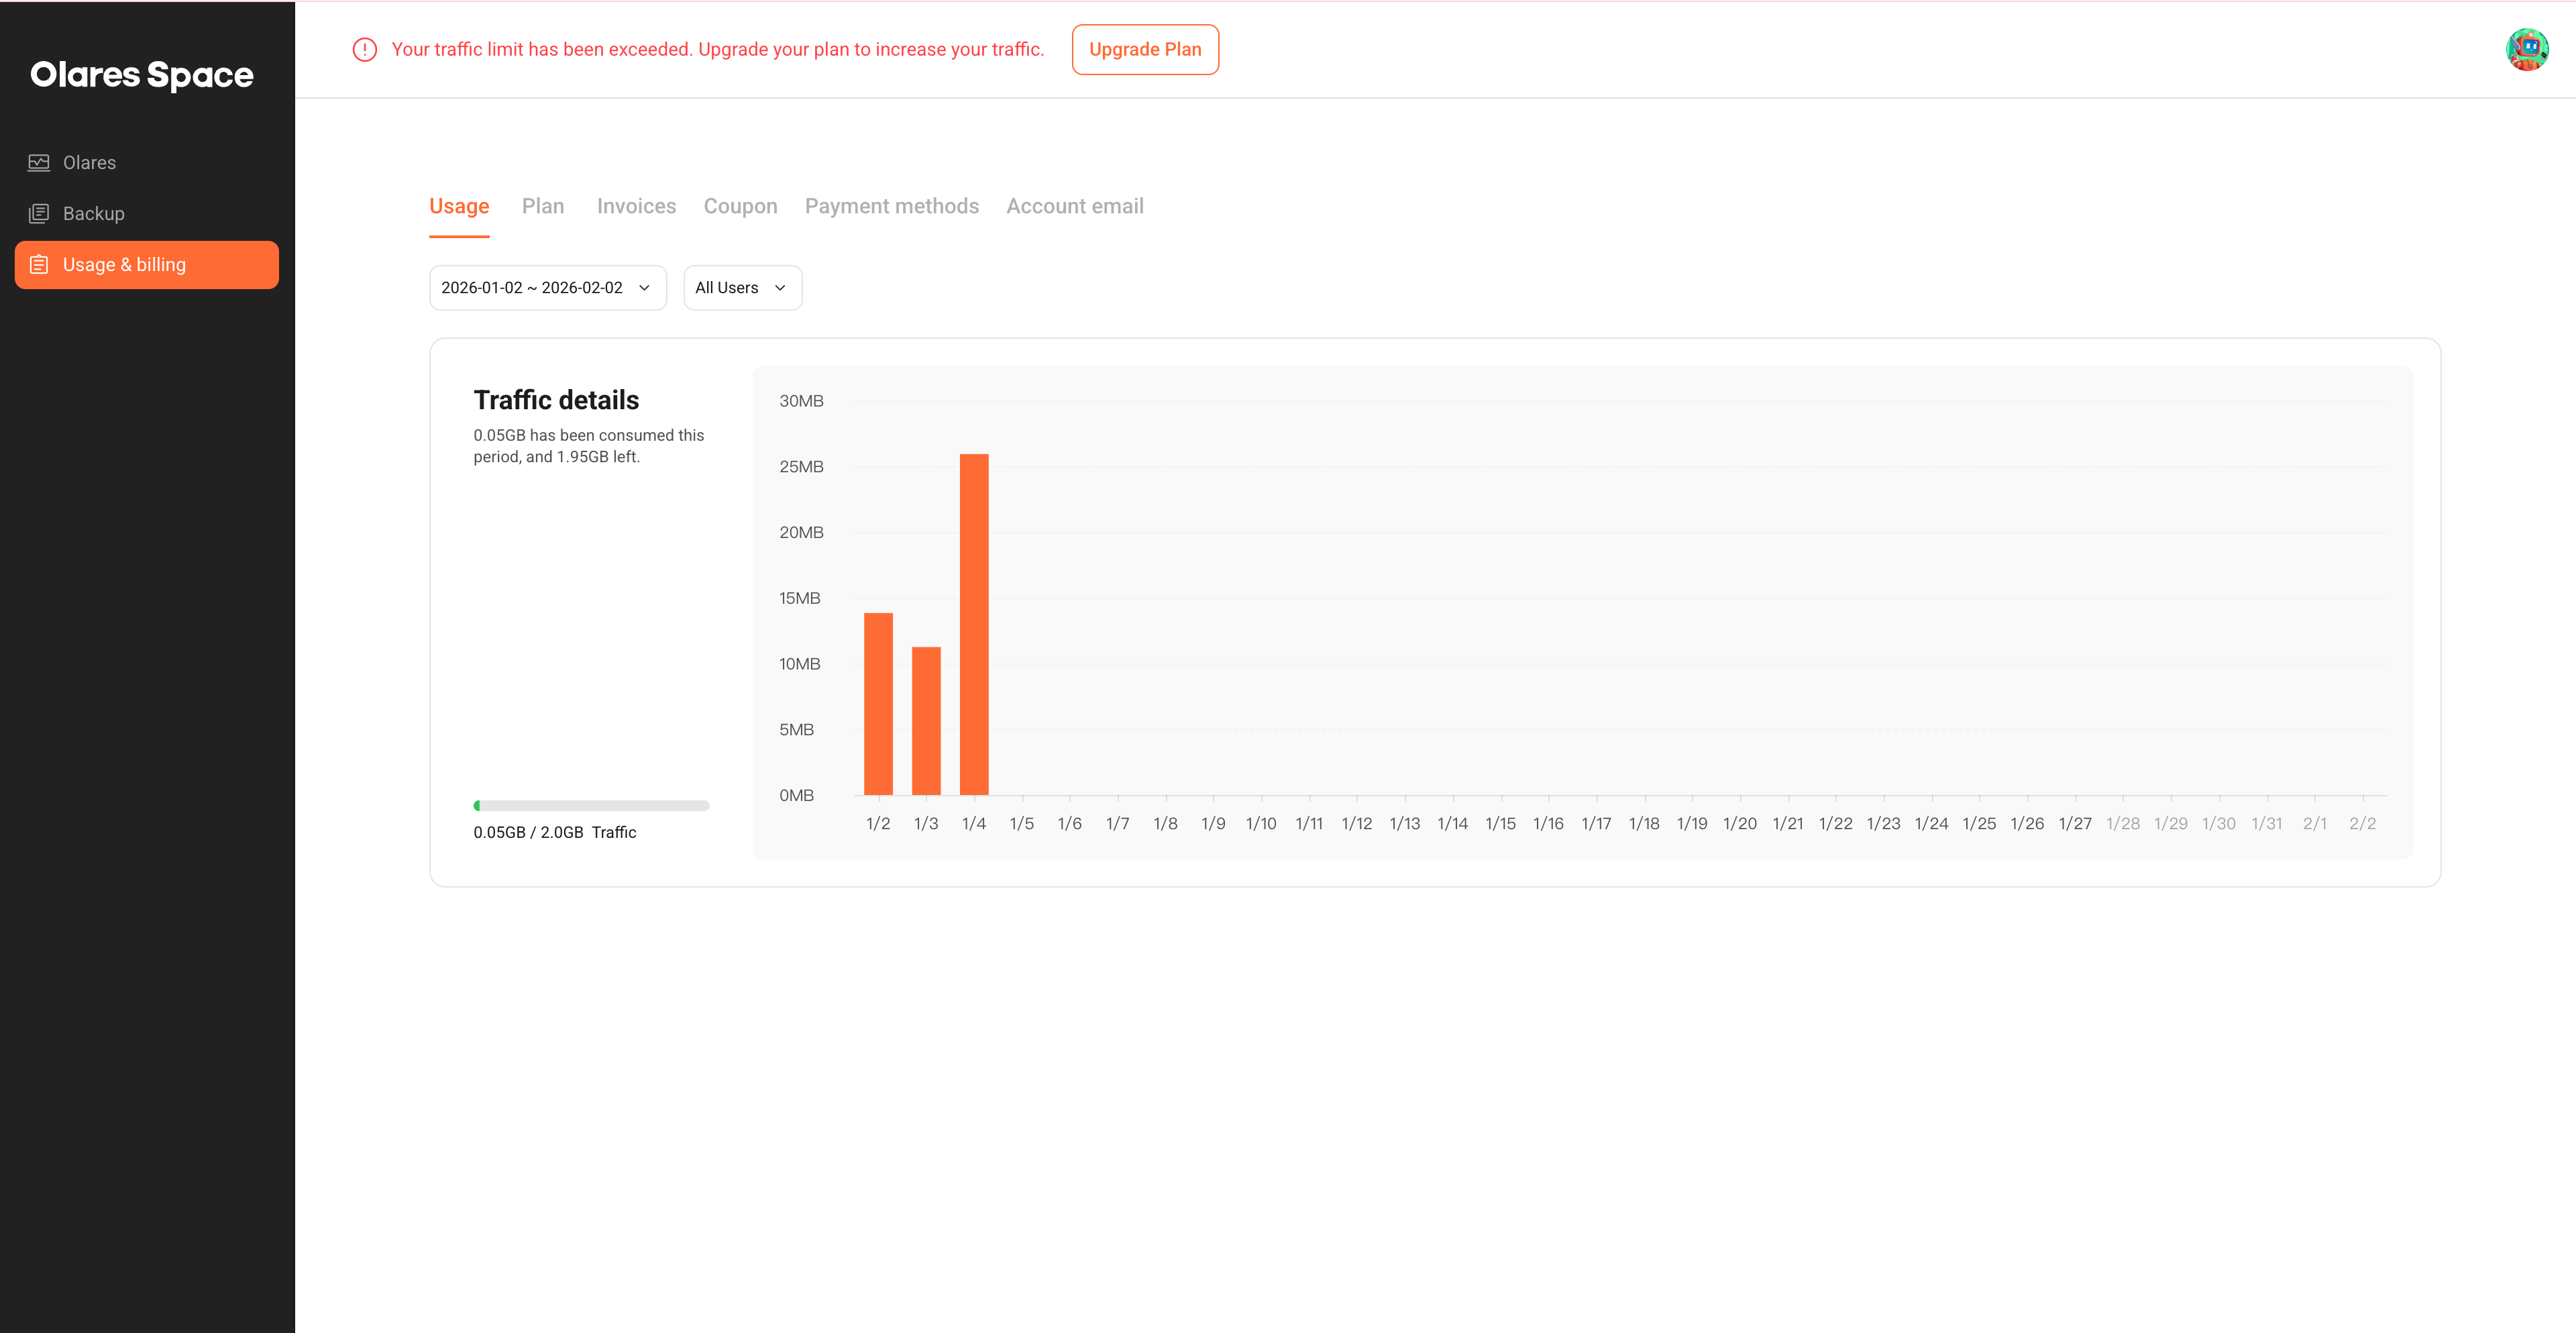
On the Usage tab, locate the Traffic details section. By default, the traffic details of the latest billing cycle are displayed.
- Progress bar: Shows how much data you have consumed against your plan's limit. For example, 0.05 GB/2.0 GB.
- Daily chart: A bar chart displaying your data usage day by day, helping you spot sudden increases in activity.
To view a previous billing period, select one from the date range drop-down list.
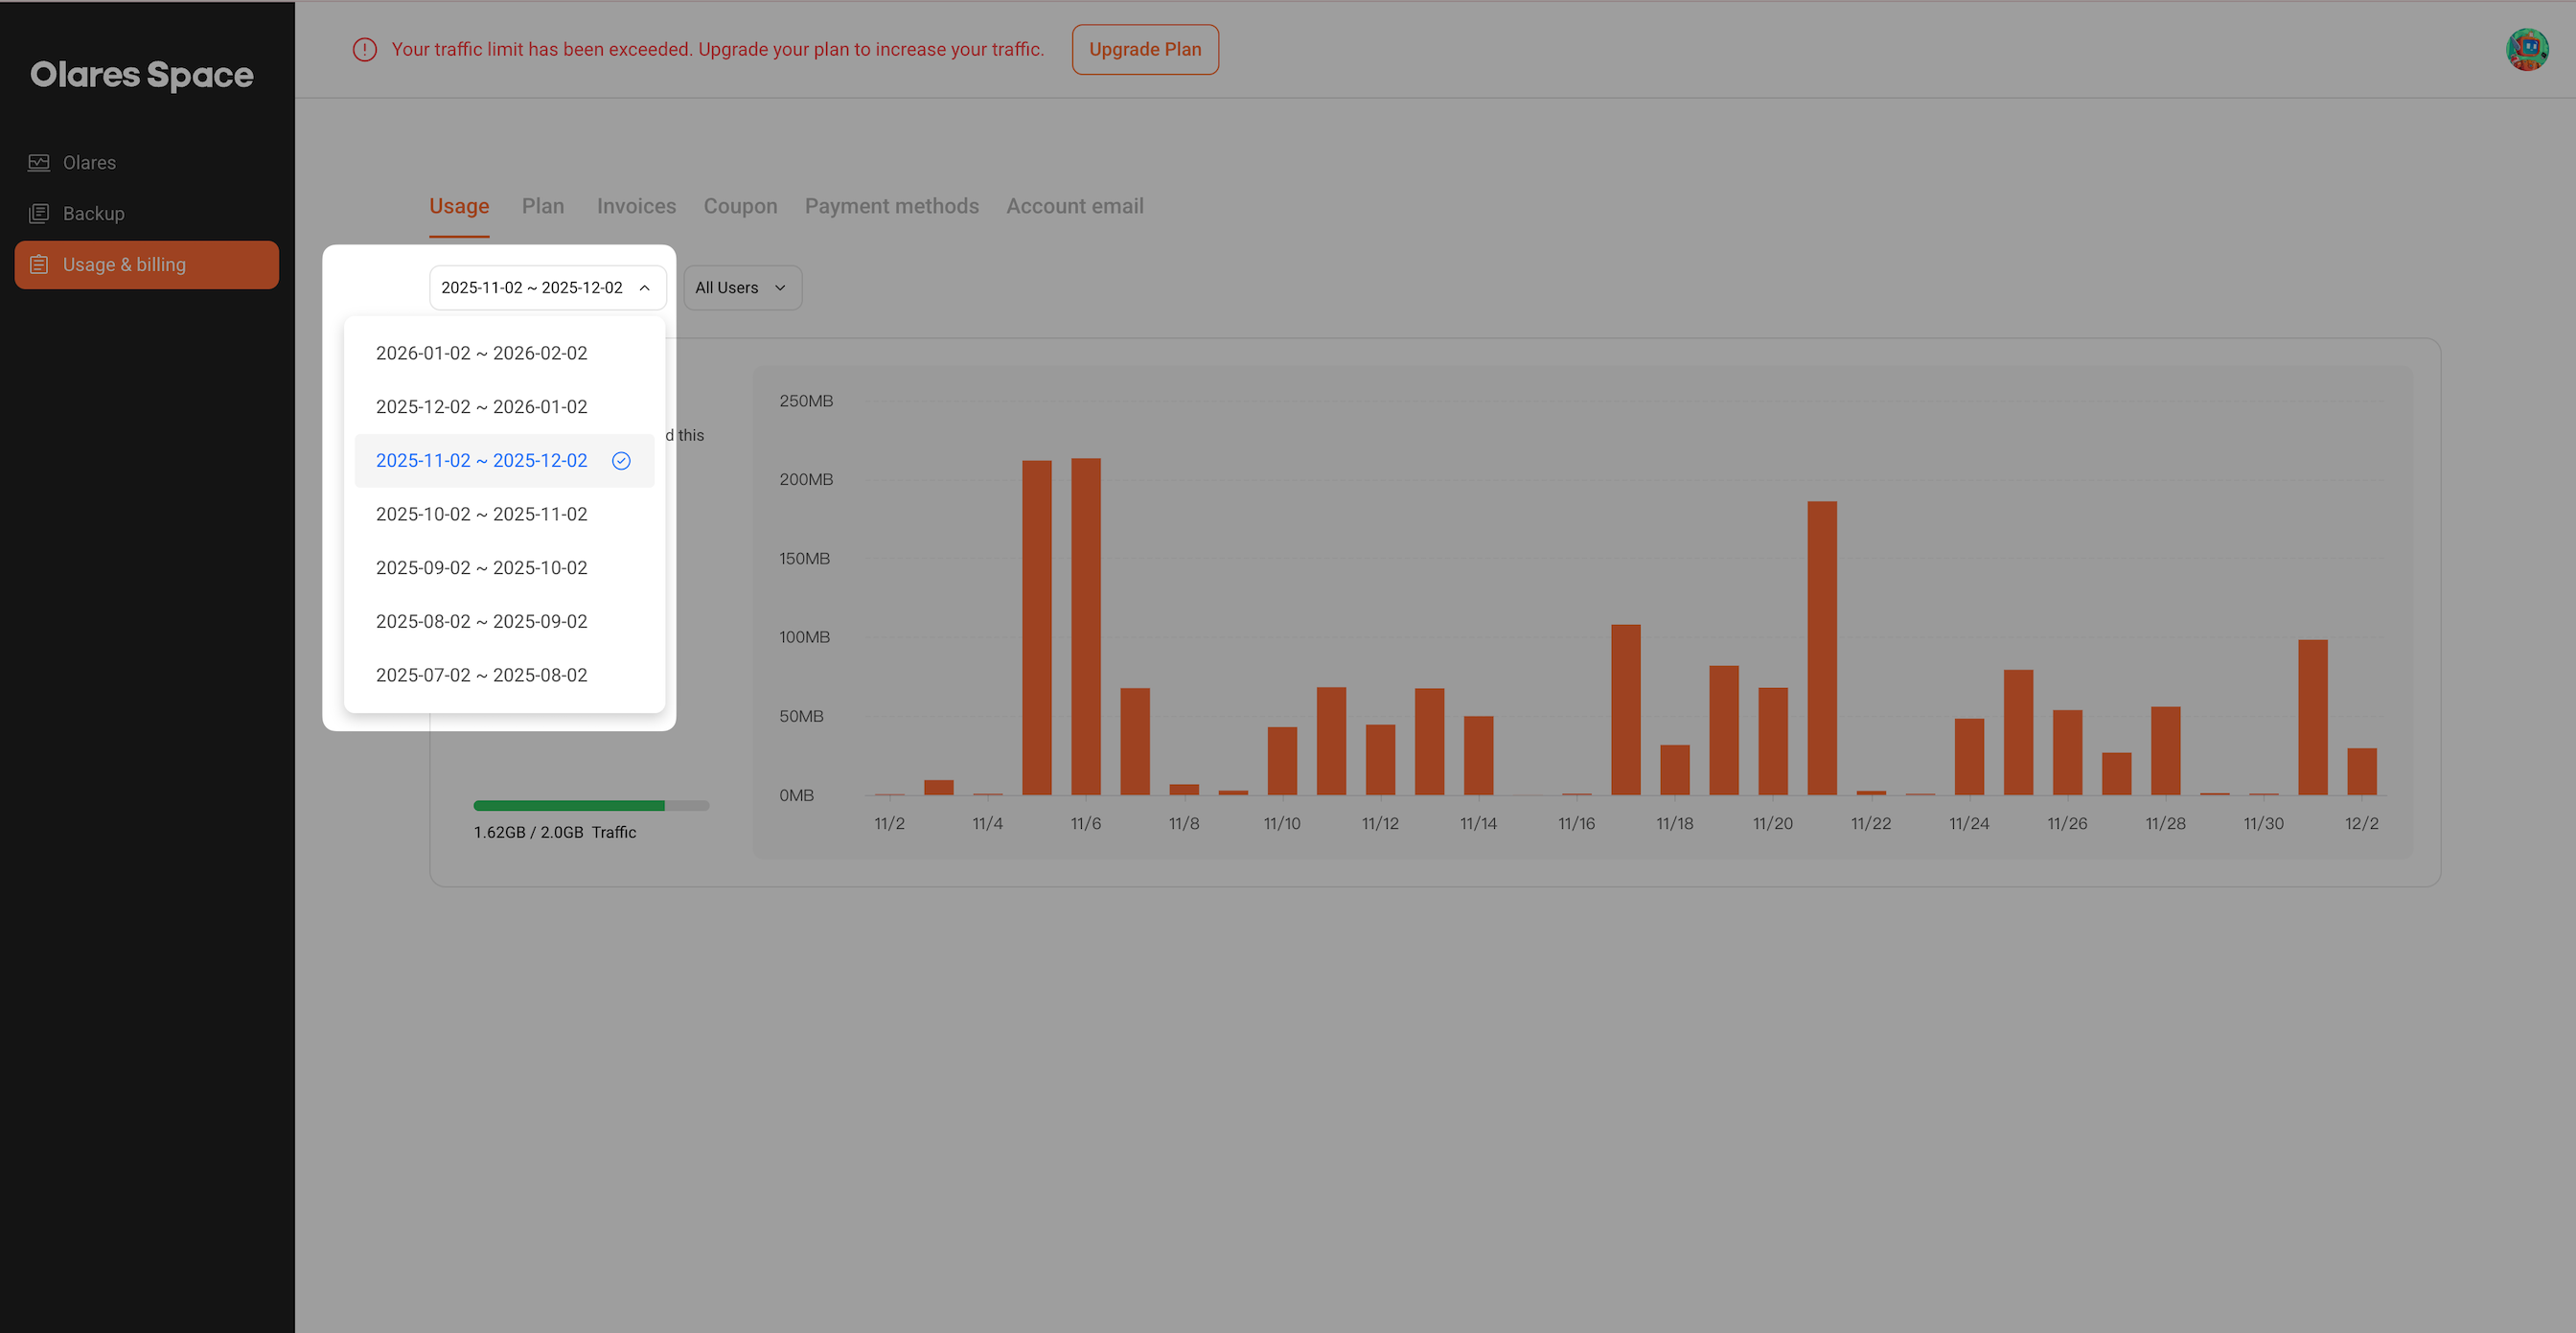
To view traffic for a specific user, select the account from the All Users drop-down list.