"System error" in LarePass
Use this guide when the System section in LarePass displays "System error". There can be multiple underlying causes for this message, so follow the steps below to collect diagnostic information and then share the results with the Olares team.
INFO
This guide uses Olares One as an example. If you installed Olares on your own hardware, the diagnostic steps are the same, but the way you access the terminal might differ.
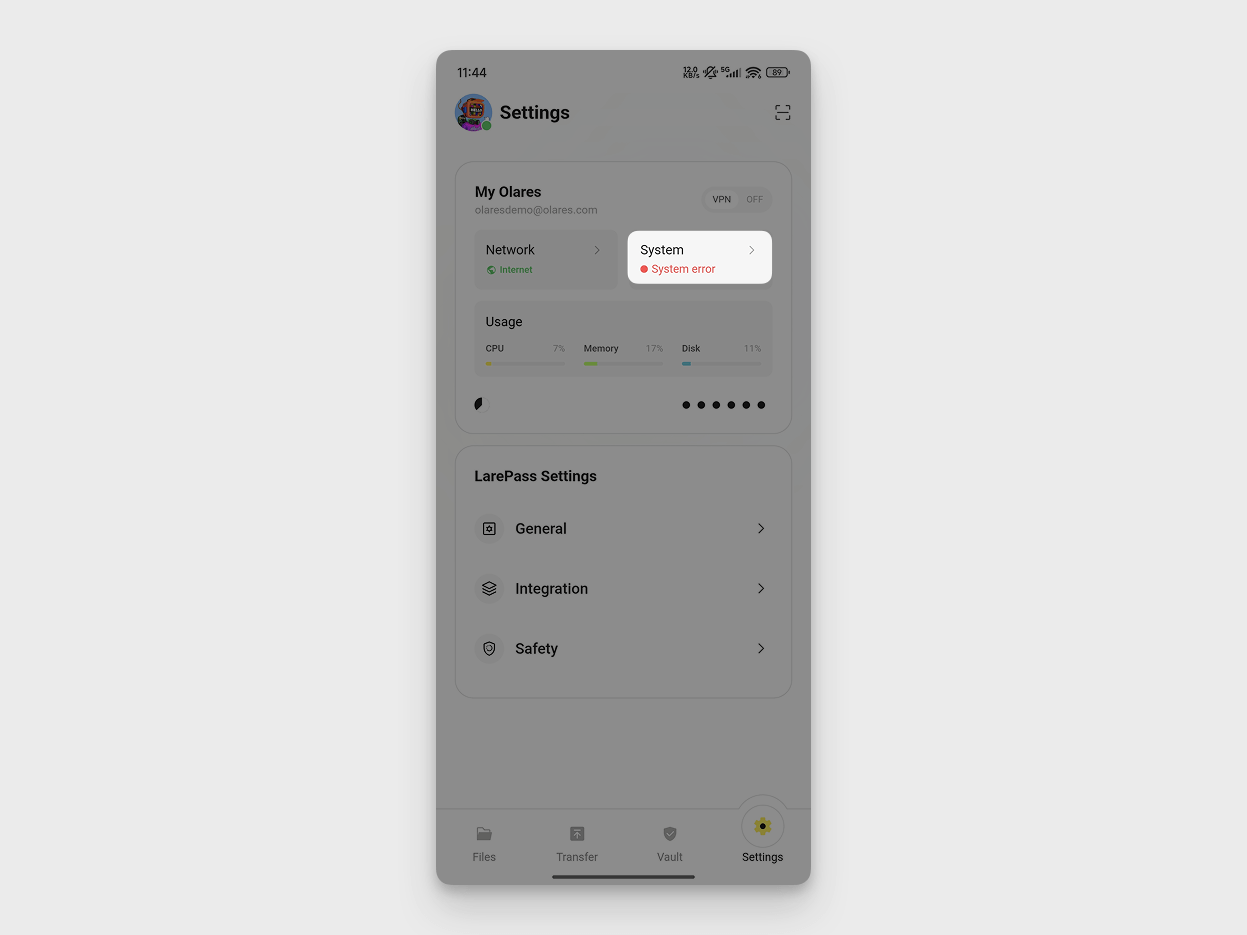
Condition
- The System section in LarePass shows System error instead of Running.
- The Olares desktop might be inaccessible.
Cause
The message means LarePass could not obtain a healthy system state. One or more system pods might be unhealthy, but the message alone does not identify the failing component or root cause.
Solution
Follow the steps below to access the device terminal, identify any pod that is not running normally, and inspect only the event information needed to narrow down the cause.
Step 1: Try to access Olares desktop
If you can still access the Olares desktop, open Control Hub and use its built-in terminal.
Open a browser and access your Olares Desktop:
texthttps://desktop.<username>.olares.comOpen Control Hub.
In the left sidebar, under the Terminal section, click Olares.
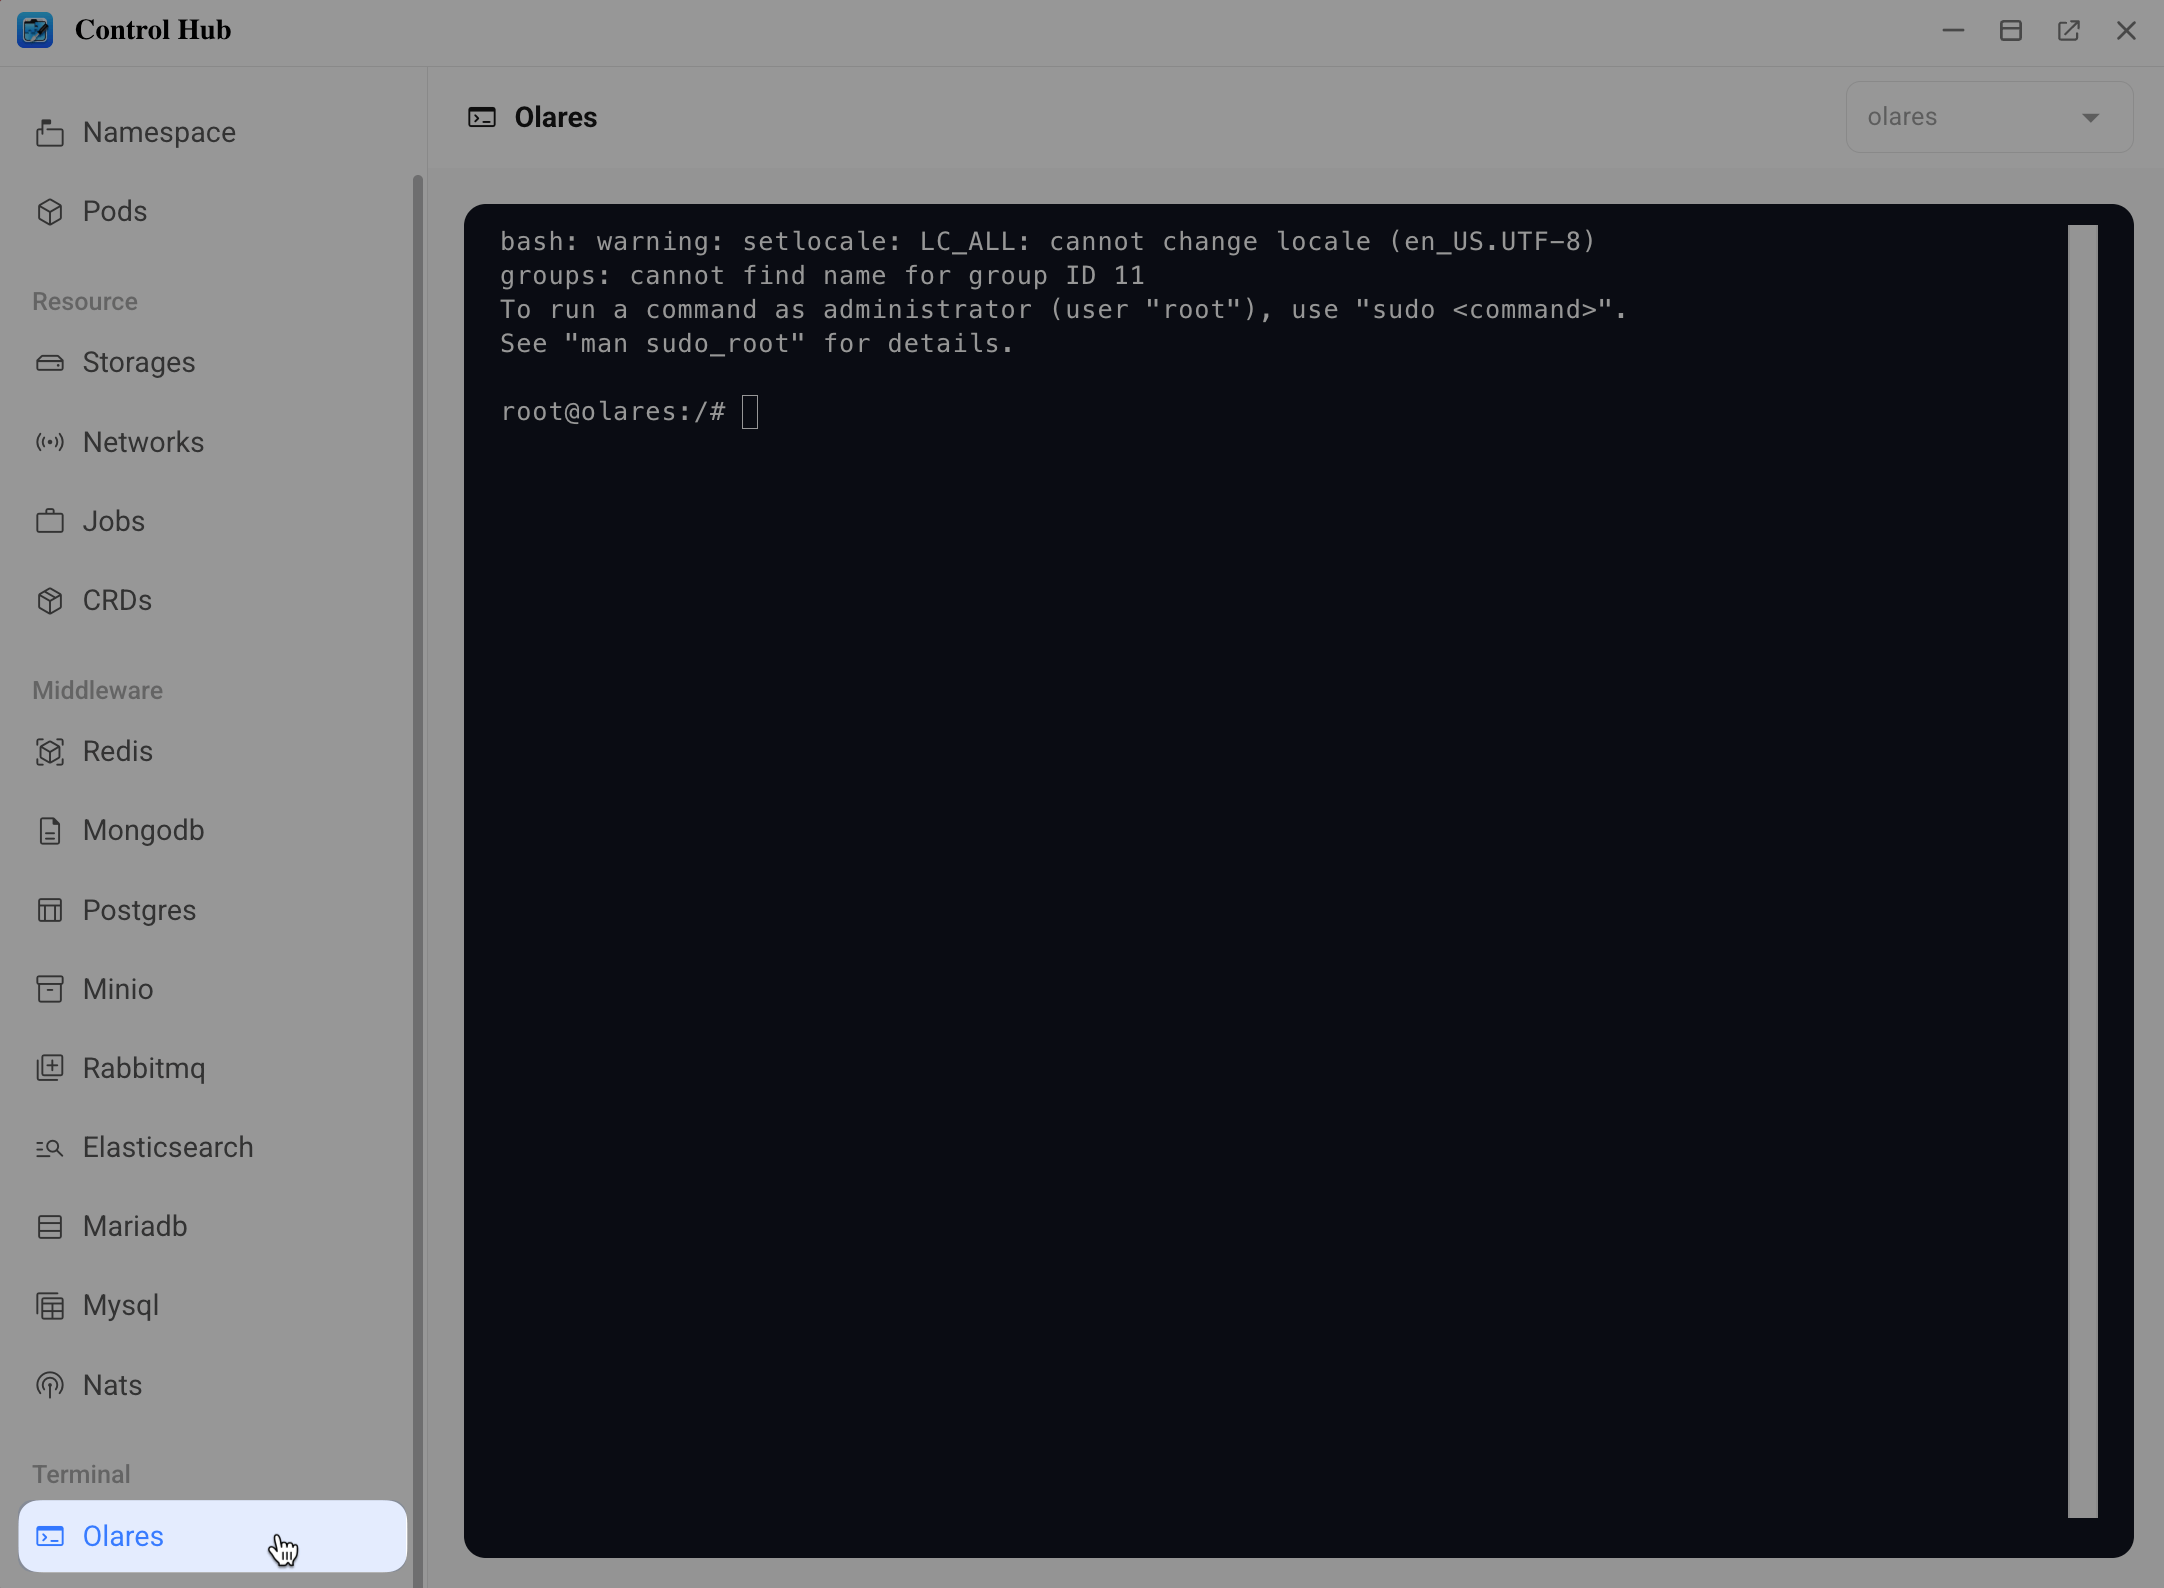
If you can access the terminal successfully, skip to Step 4.
Step 2: Connect via SSH
If you cannot access the Olares desktop, try connecting via SSH.
Same network required
Your computer and Olares One should be on the same local network.
Get the local IP address of your Olares One.
a. Open the LarePass app and go to Settings > System to open the Olares management page.
b. Tap the Olares One device card.
c. Scroll down to Network and note the Intranet IP.
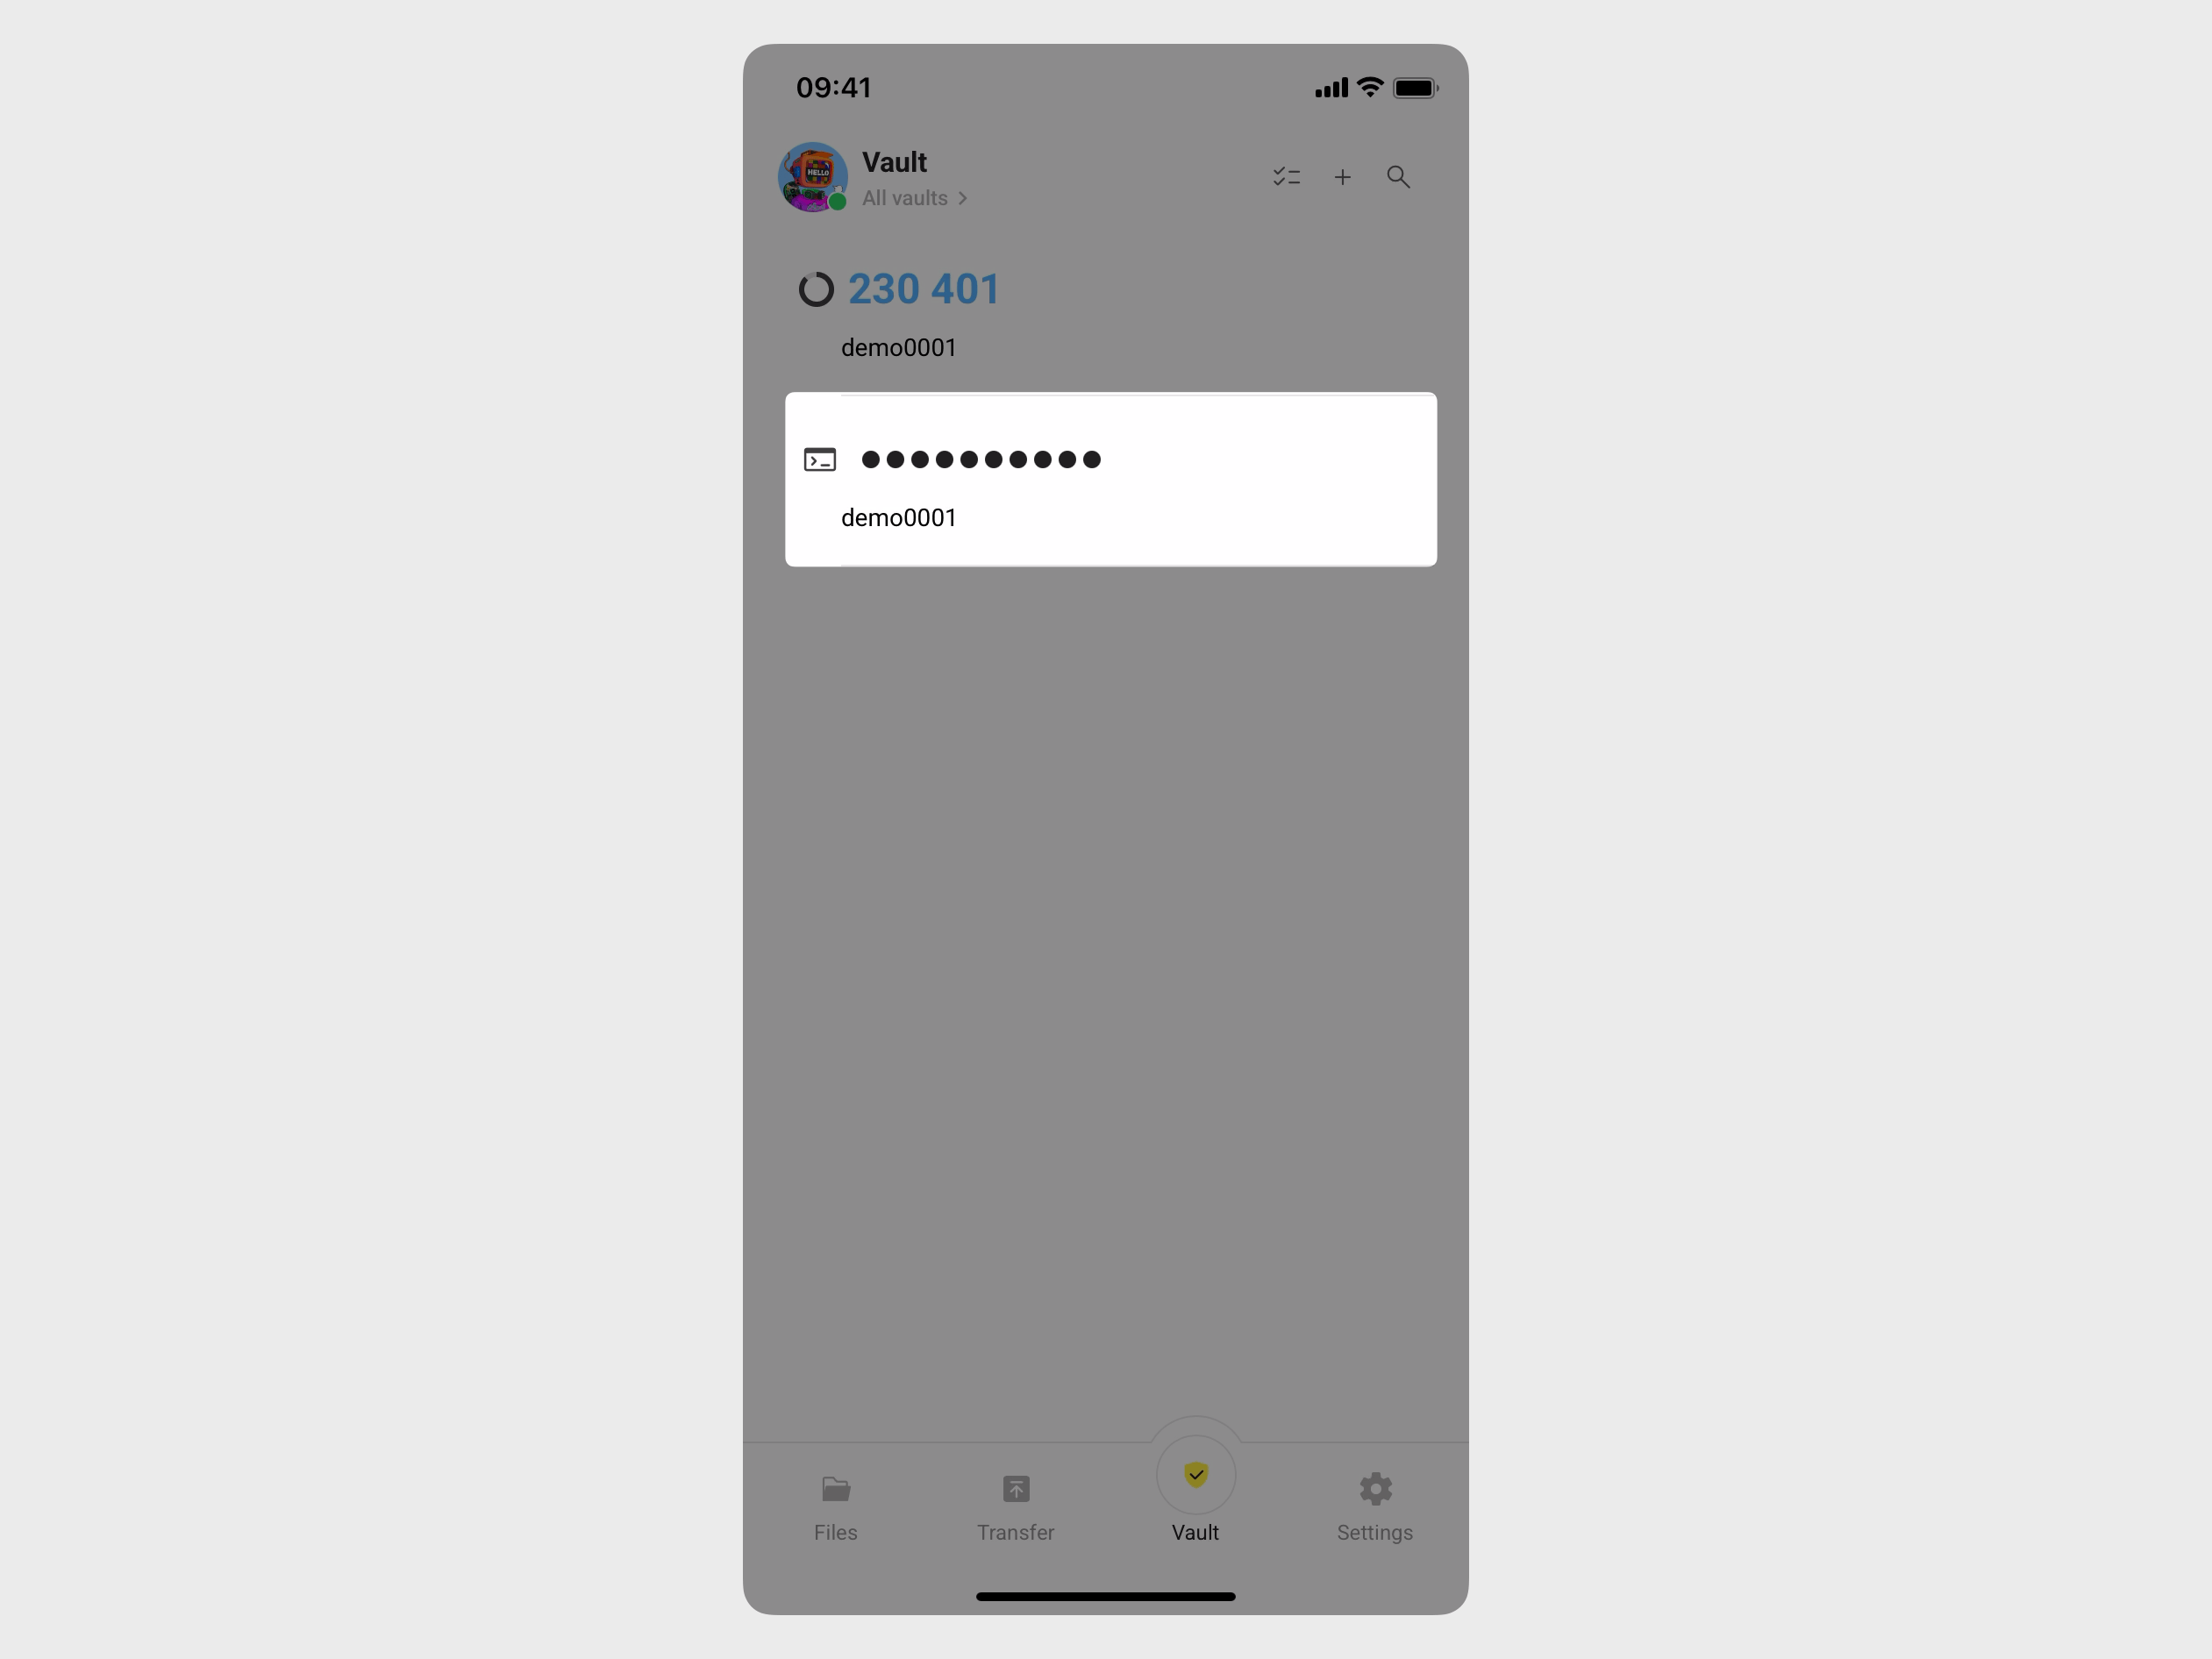
Find your SSH password in Vault.
a. Tap Vault in the LarePass app. When prompted, enter your local password to unlock.
b. In the top-left corner, tap Vault to open the side navigation, then tap All vaults.
c. Find the item with the terminal icon and tap it to reveal the password.
Open a terminal on your computer and connect via SSH.
a. Run the following command, replacing
<local_ip_address>with the Intranet IP you noted earlier:bashssh olares@<local_ip_address>b. When prompted, enter the SSH password.
If the connection is successful, skip to Step 4.
Step 3: Log in locally
If SSH is also unavailable, log in directly on the device using a monitor and keyboard.
Connect a monitor and keyboard to your Olares One. A text-based login prompt appears automatically:
textolares login:Type the username
olaresand press Enter.Enter the SSH password from Step 2 and press Enter.
Step 4: Check system pod status
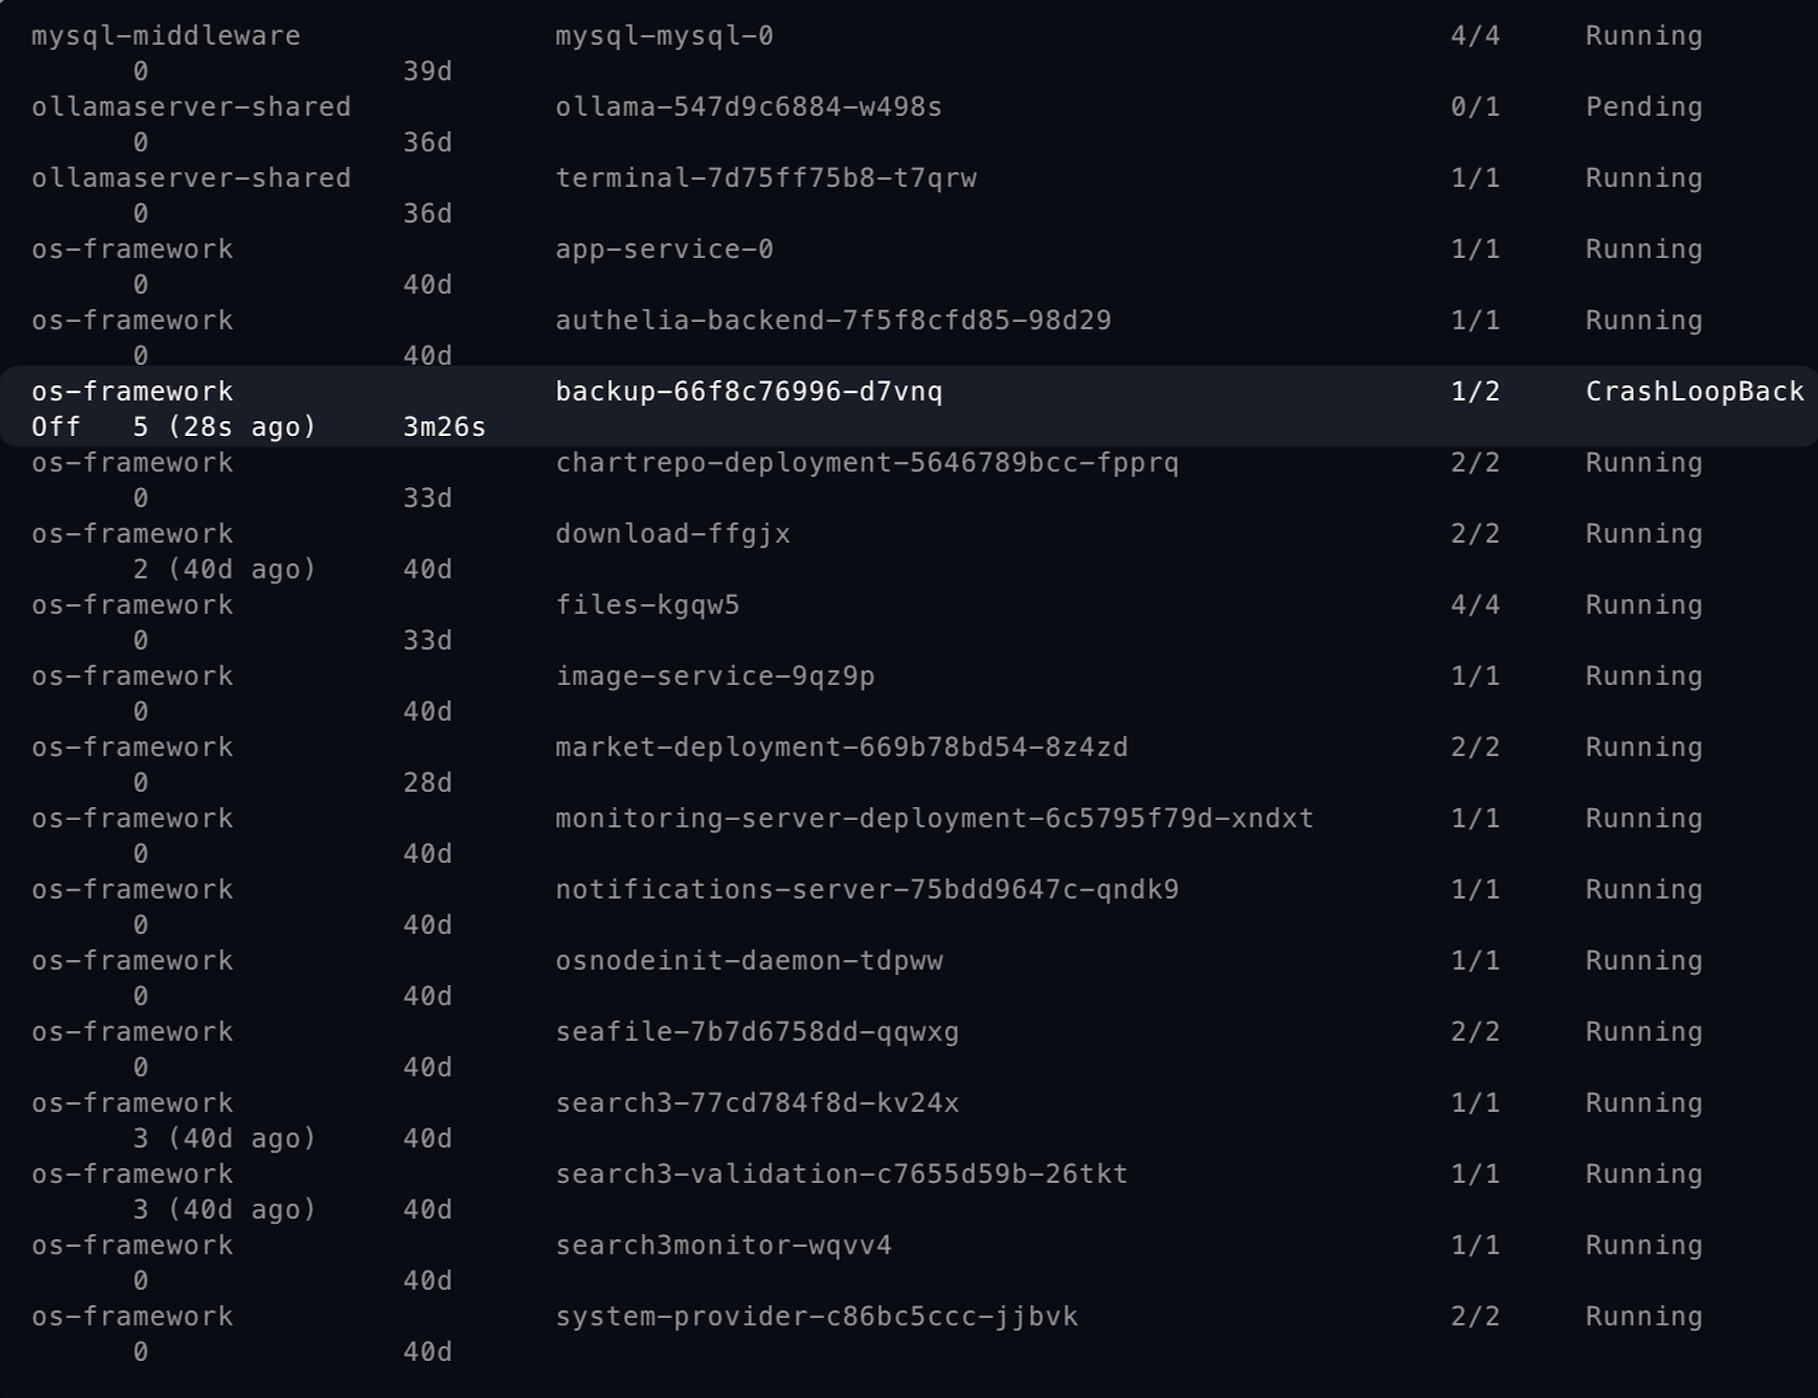
Run the following command to get the status of all pods across all namespaces:
bashkubectl get pods -ACheck STATUS and RESTARTS. Look for states such as
CrashLoopBackOff,Error,ImagePullBackOff, or a pod that remainsPending. A job inCompletedstate is not an error by itself.Note the NAMESPACE and NAME of each pod that shows an error or a restart count that keeps increasing. If none do, skip to Step 6.
Step 5: Inspect the pod error
Review output before sharing it
kubectl describe can include IP addresses, node names, Olares IDs, domains, and configuration values. Do not paste its complete output into a public issue.
Run the following command, replacing
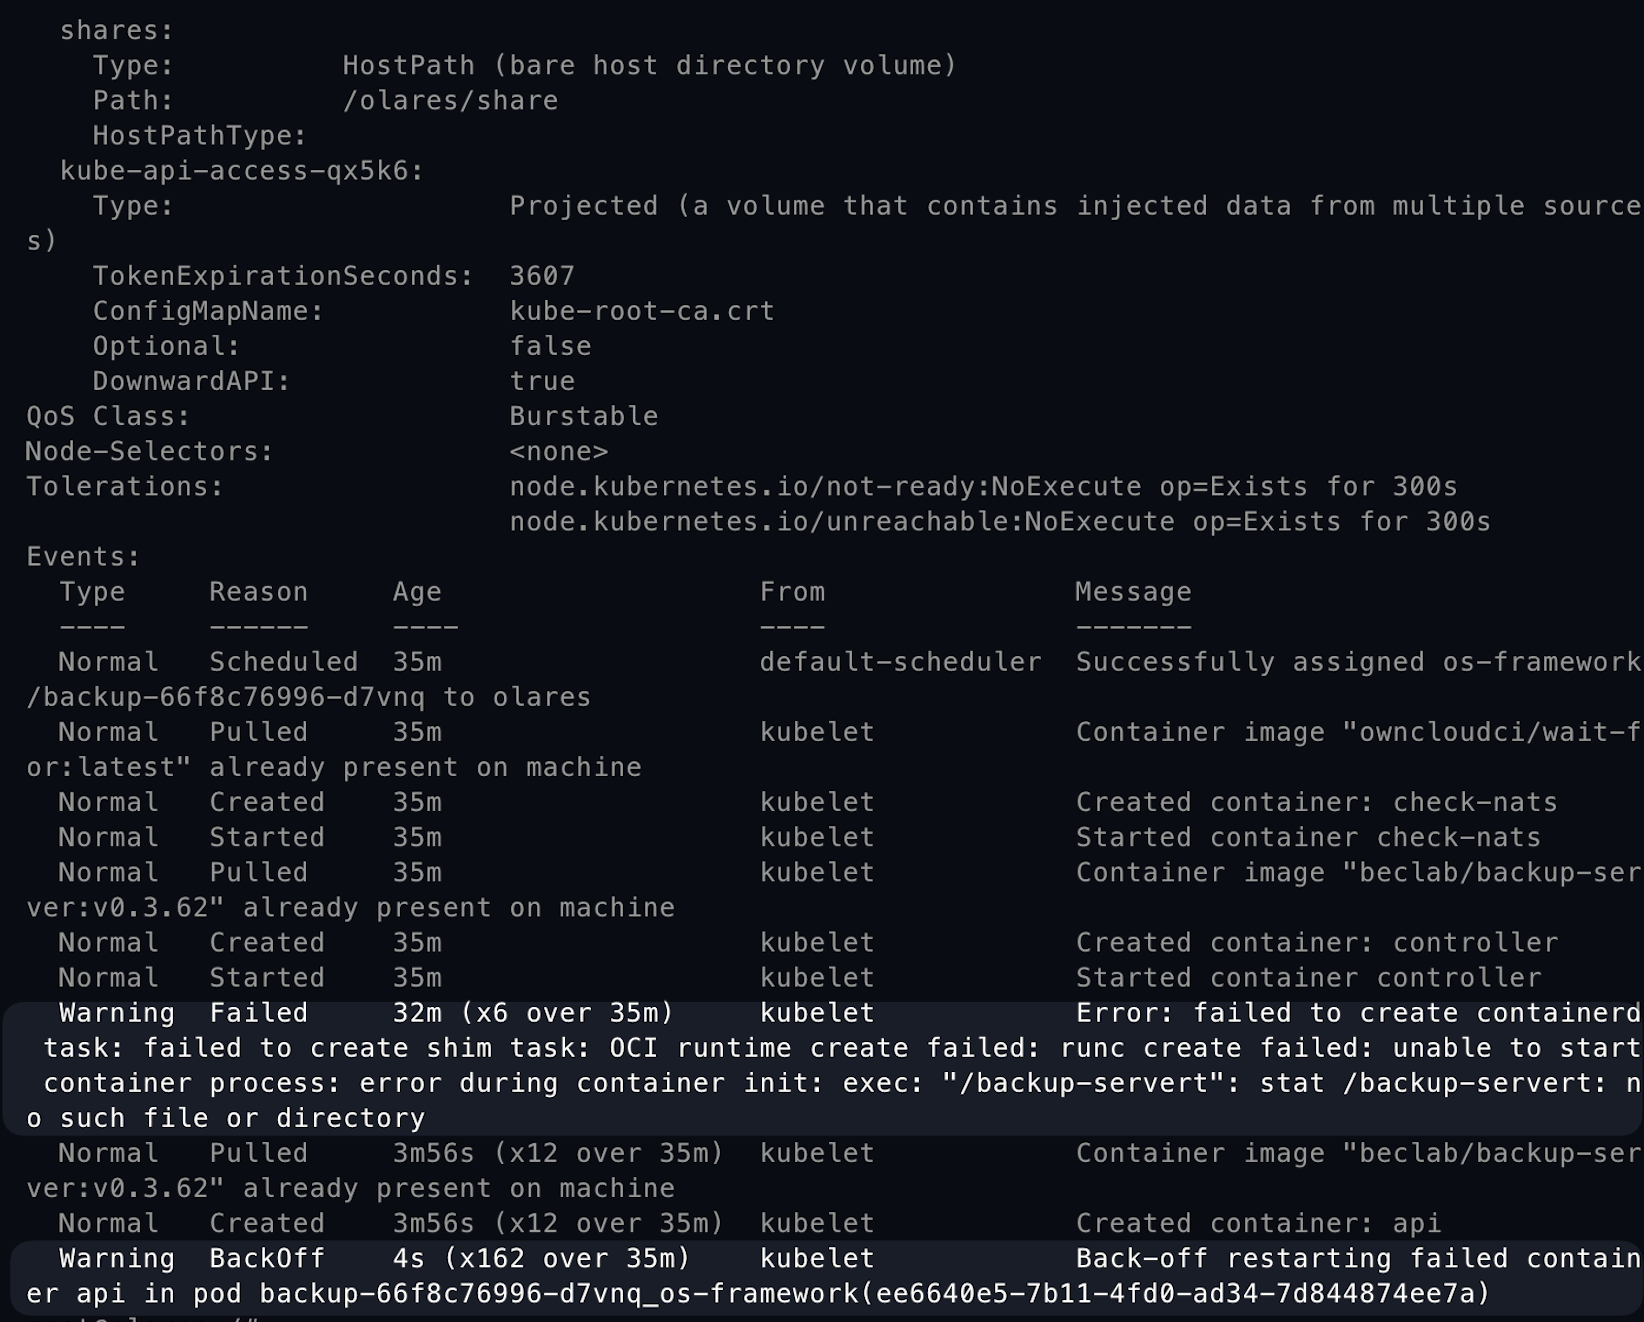
<namespace>and<pod-name>with the values you noted in the previous step:bashkubectl describe pod <pod-name> -n <namespace>For example:
bashkubectl describe pod backup-66f8c76996-d7vnq -n os-frameworkScroll down to the Events section to find the detailed error message.
Step 6: Record the result and collect logs
Record the following minimum information:
- The affected pod's NAMESPACE, NAME, STATUS, and RESTARTS values
- The error lines in the Events section
- The time the error appeared and your time zone
- Your installed Olares version and whether the error followed an update or restart
If no pod shows an error and restart counts are not increasing, record that result instead. It means the message cannot be explained by pod status alone and needs a different diagnostic branch.
For a reproducible software bug, you can open a GitHub Issue with the symptom and the limited fields above after redacting IDs, hostnames, IP addresses, and domains. Follow Collect diagnostic information to create the full log archive, and send it only through the private channel described there.