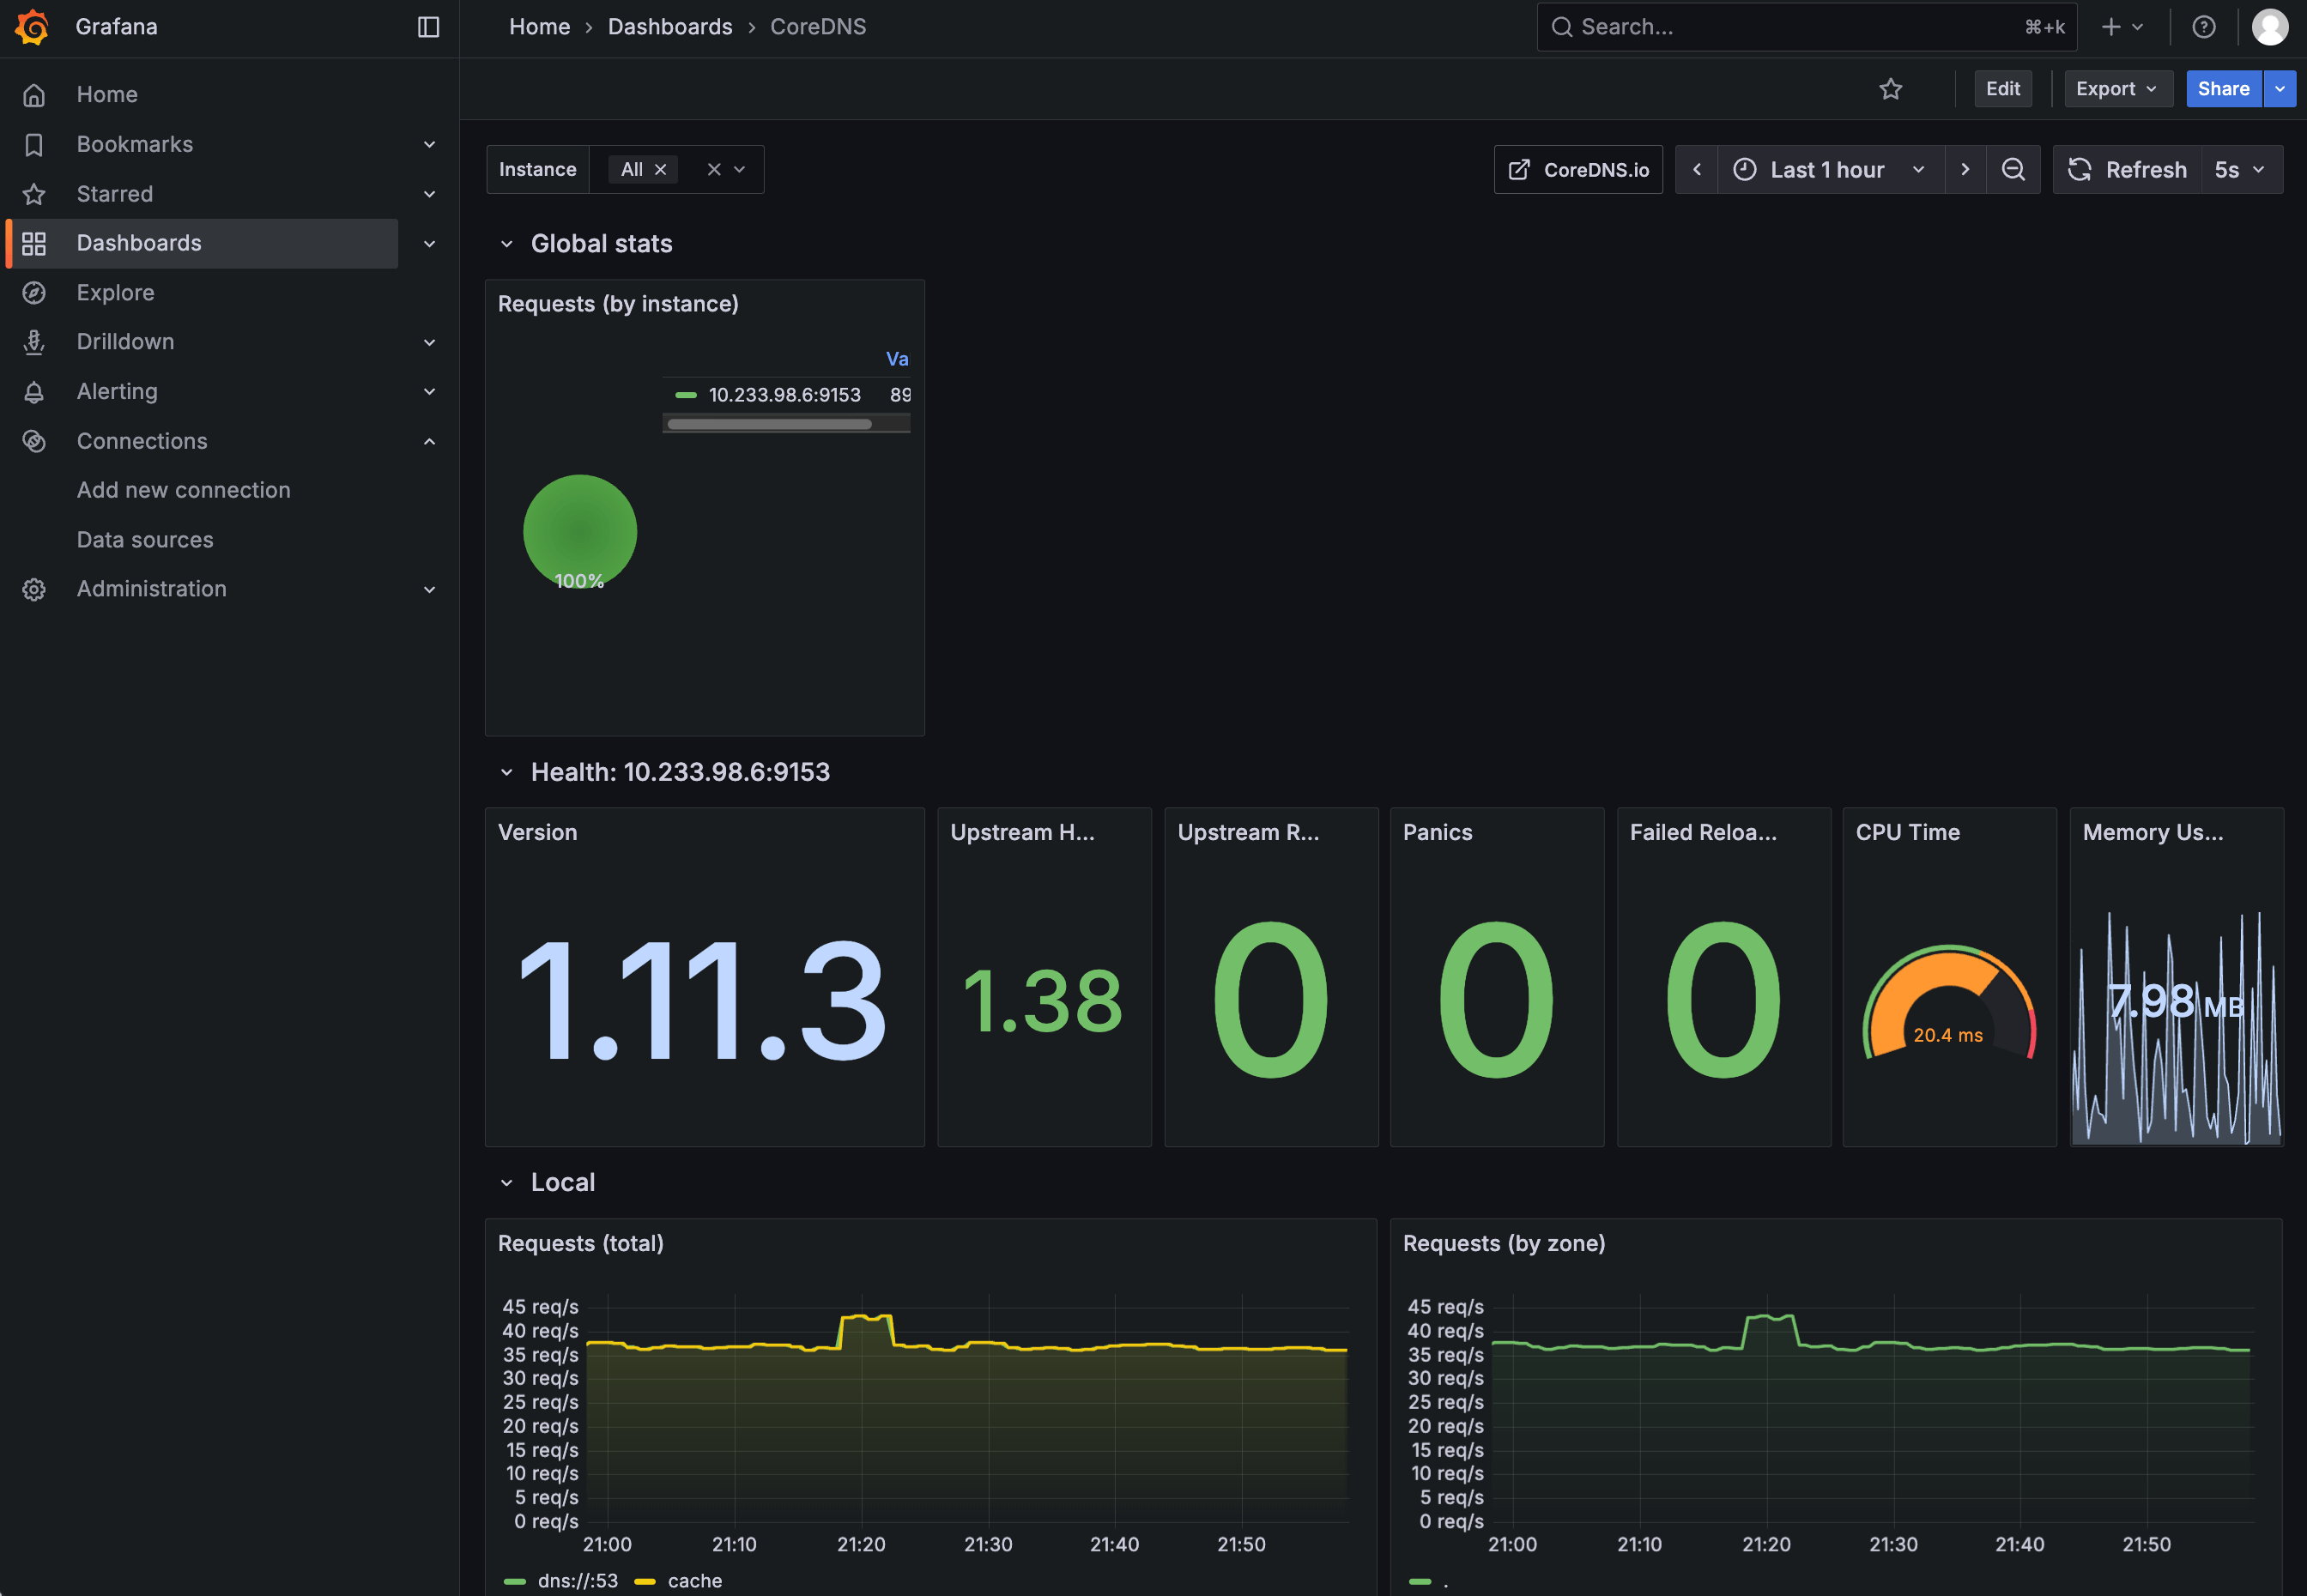
Use Grafana dashboards
To visualize system metrics in Olares, you can run Grafana and connect it to the Prometheus service. This guide explains how to install Prometheus and Grafana, connect the data source, and import a standard dashboard.
Install Prometheus
Before installing Grafana, install Prometheus from Market. Prometheus collects system metrics for Grafana to visualize.
- Open Market from Launchpad and search for "Prometheus".
- Click Get, then Install.
- Wait for the installation to complete.
Install Grafana
After Prometheus is installed, install Grafana from Market.
- Open Market from Launchpad and search for "Grafana".
- Click Get, then Install.
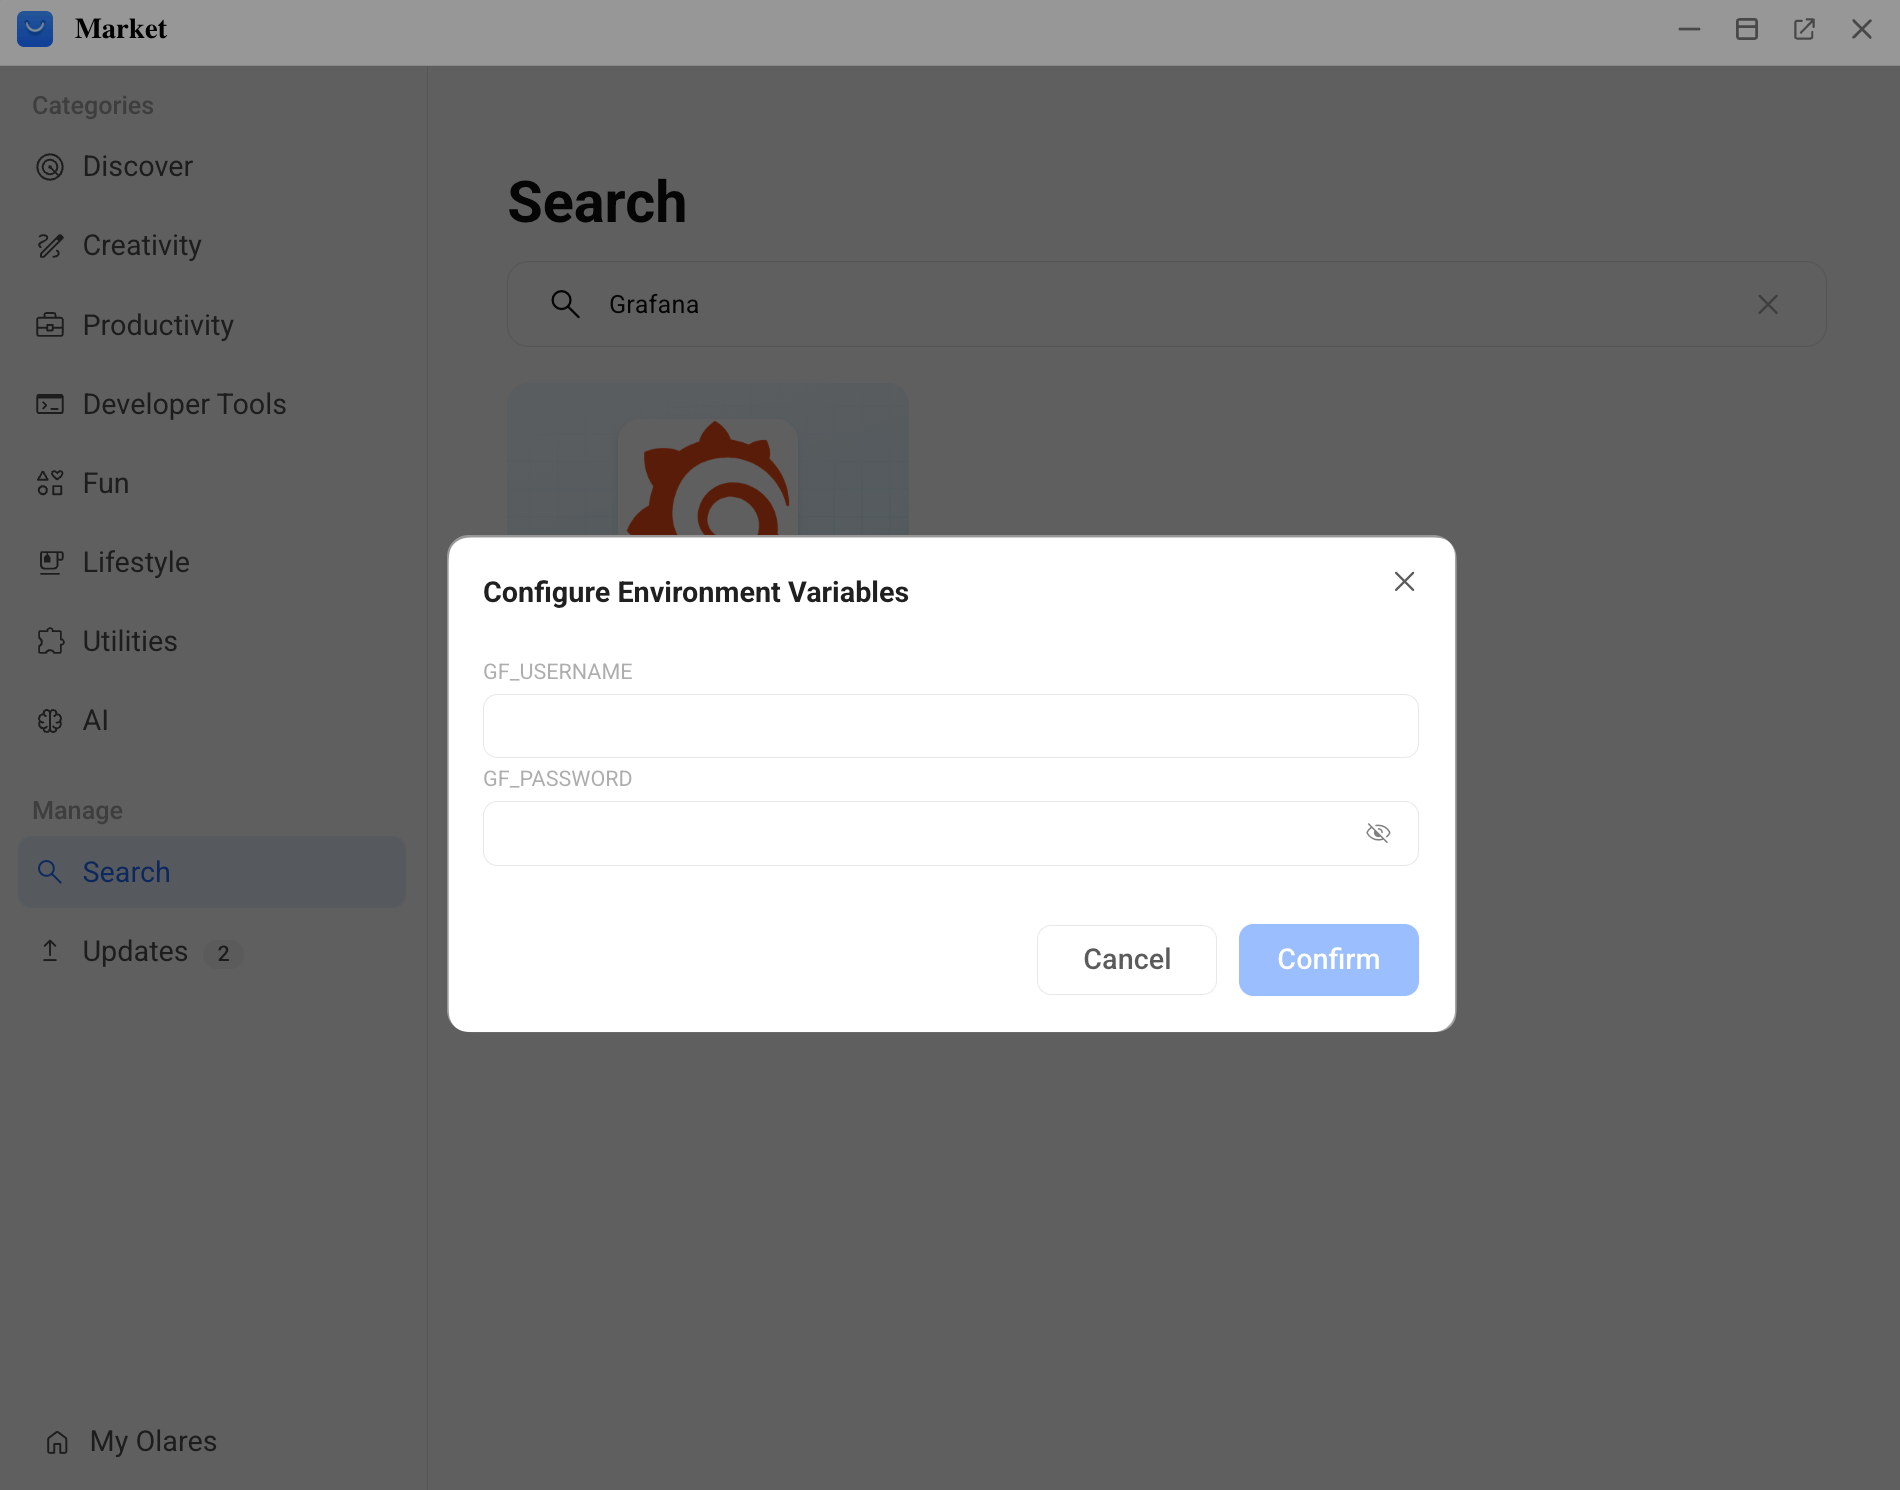
- In the pop-up window, set your login credentials:
GF_USERNAME: Grafana login username.GF_PASSWORD: Grafana login password.
Remember your login credentials
These are the login credentials for Grafana. You will need them if you access Grafana later.
- Wait for the installation to complete.
Access Grafana
- Open Grafana from Launchpad, then click open_in_new to open it in a new tab.
- On the login screen, enter the
GF_USERNAMEandGF_PASSWORDyou configured during installation.
After logging in, you will see the Grafana home page.
Add Prometheus data source
To connect Grafana to Prometheus, first get the Prometheus API endpoint URL, then add it as a data source in Grafana.
Get the Prometheus API endpoint URL
How app endpoints work
When a client connects to another Olares app, it uses that app's endpoint as the network address. If the app exposes multiple endpoints, choose the one that matches the feature or protocol the client needs.
For Prometheus:
- Go to Olares Settings > Applications > Prometheus > Entrances.
- Select Prometheus API, then copy the Endpoint URL. For example:textReplace
https://4ae9f19e1.<olaresid>.olares.com<olaresid>with your Olares ID.
Use this Endpoint as the Prometheus server URL in Grafana.
Configure the data source in Grafana
- In the Grafana left navigation pane, go to Connections > Data sources.
- Click Add data source, then select Prometheus.
- For the Prometheus server URL field, enter the Prometheus API Endpoint you just copied.
- Click Save & test at the bottom of the page. If the connection is successful, you will see the prompt below.

Create a dashboard
This approach is suitable when you need custom metrics and visualizations and are familiar with PromQL.
- In the left navigation pane, click Dashboards.
- Click + Create dashboard, then select + Add visualization.
- Select prometheus as the data source.
- Configure panels, PromQL queries, and expressions as needed.
- Click Save dashboard in the top-right corner for future use.
Import a dashboard (recommended)
If you do not need to build dashboards from scratch, you can import existing dashboards.
- Visit the Grafana Dashboard library.
- Download the required dashboard as a
JSONfile. - In Grafana, click add_2 in the top-right corner and select Import dashboard.
- Upload the
JSONfile, and select prometheus as the data source. - Click Import to complete the import.
Imported dashboards provide predefined panels and queries and can be customized after import.